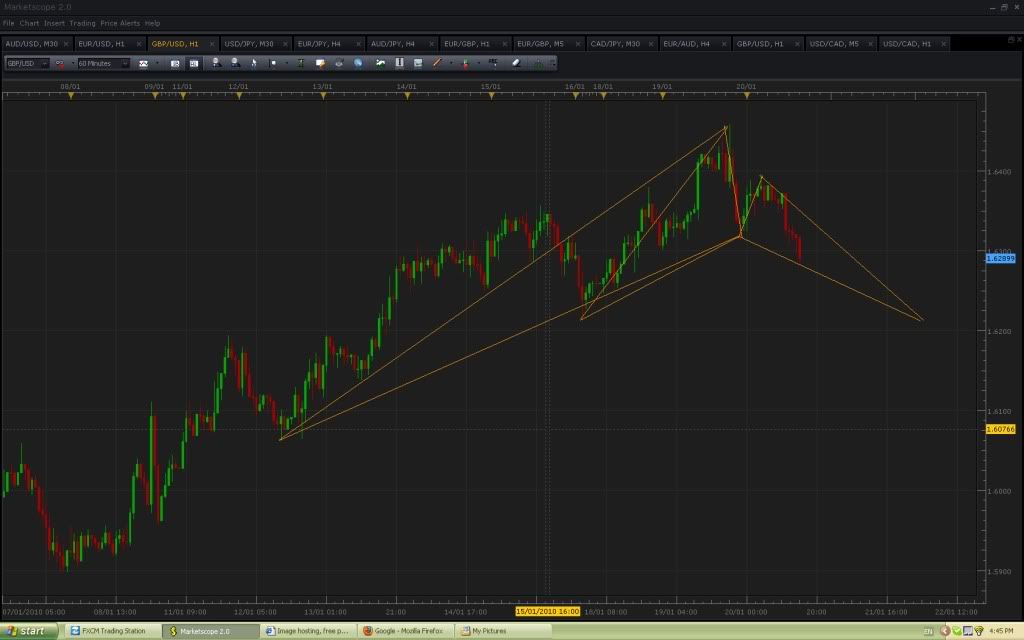
I have that same pattern - my B and C are in different positions, but my D is in a very similar spot.
Hi guys, I have this pattern currently on its way, D at 91.67. Depending on how it finally develops, I will take it or let it go.
I also have this butterfly on the 4hr chart. Aud/usd. There’s a D at 0.9100, but for me it’s more likely that the true D will be 0.9030
thanks wrtm, aussie .9030 looks very nice.
Yeah I like it, I’ll try to post more often, for the moment these are the patterns that I’m paying attention to.
Cheers 
didn’t want the news risk so thankfully scratched this prior to cad cpi. there is now a clear trendline break on the daily and weak fundamentals (cpi). long patterns could be the go.
Yep, it appears that it was valid. Although I entered a little bit late, still made 50 pips on that pattern.
(Still trying to figure out the best way to post image and my last one seemed to be “off” with everyone elses).
wrtm,
For USD/JPY bearish gartley under 1hr, are you sure B and C are correct?
Also for EUR/JPY bullish gartley under 8 hr, I drew it under 4 hr and found the D, but I’m not sure if there is a good enough convergence in fib levels of XA and CD?
Just wanted to ask if you had successes with the above instances.
However, I’m keeping a close eye on GBP/USD pattern as well. It seems like it will be a good one.
Thanks!
I sure didn’t take it - had to go to class early this morning, so I ended up sleeping right through it - lucky me!
Hi Maestro,
Usd/jpy is no longer valid to me, but yes before that B and C were correct.
Regarding Eur/jpy it was a really good pattern, nice convergences I spotted, although it didn’t work, I was stopped out at Break Even.
Kiwi pattern I didn’t take it, It developed too fast in my opinion.
Cable I¡m still waiting for it, looks promising to me.
Hope that helps. 
Maestro,
Now this is my call for usd/jpy, although is too early to talk about it, but this is how things look to me now. 
Something interesting to look at here on the EUR/USD daily
It is still a long way off (my “D” is in April) but if I drew it correctly it shows a the down trend continuing in the EUR/USD for a while longer. This could be helpful to know if you are looking to get in on a trade on this pair in the future. Will keep my eyes peeled
Note: there is also a close convergence of the 0.500 of XA and the 0.786 of CD so you could see a bounce at this level as well. Anybody got any input?
Good Luck
racerdude777
Lol, I didn’t trade this pattern since I didn’t like the set up, and now it looks like it’s working 
Anyone traded it?
Loonie, 4hr chart.
I didn’t even notice that pattern - I don’t think I looked at the 4 hour chart on the loonie, only the 1 hour, and I didn’t get any convergence at that point. Next time I guess I’ll have to do a bit more searching!


