GBPUSD pattern forming possibly
Damn you, although i notice there is no abcd in the cd leg. Does this invalidate the pattern?
Here is the pattern I drew… It looks like it has defined legs to me but I could be wrong
It hasn’t reversed very hard, I haven’t gotten more than 20 pips before it drops back down to the convergence level… I may have to close it out
UPDATE: Speak of the devil… just dropped 20 pips and closed below the convergence level… had to close the trade for a ~15 pip loss 
sorry to hear that racerdude.
i left it alone because i had too many questions, and i am not familiar with the pair. wide spread and the pip movements looked too large for me. I would have had to halve my positon and doubled my stop which i wasn’t to keen to do.
i’m just watching london for now, tempting to sell gj, i have a signal, but i have another 100 pips above haha.
think i’ll remain a spectator. mkt dynamicas appear to be changing and i am clueless.
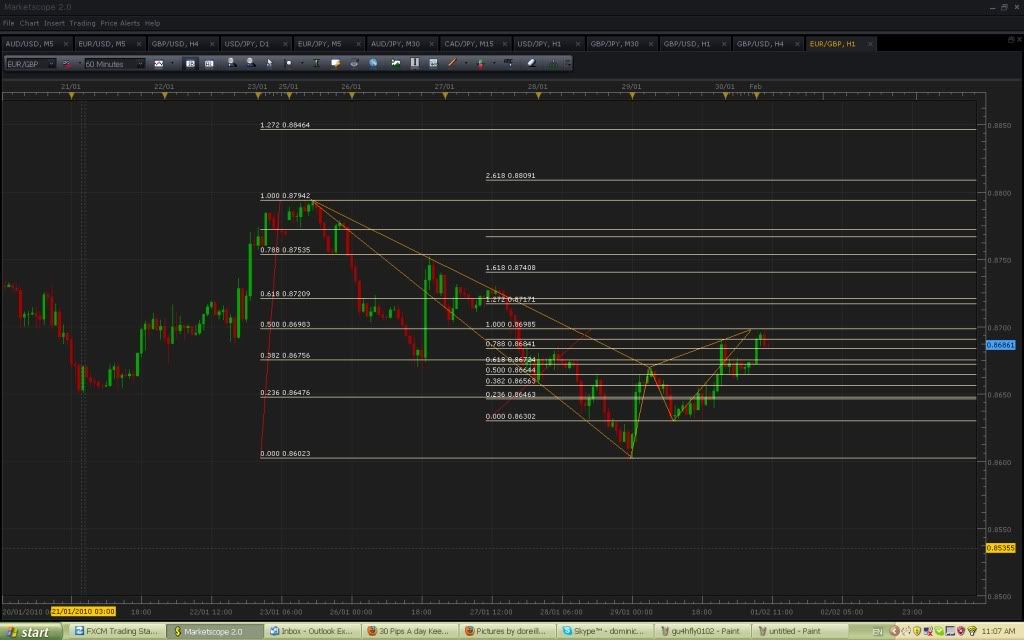
for what it’s worth, this is what i have on the gj, but as i said i will (somewhat reluctantly) only consider the second D. could get there easily (and quickly) if uj breaks thru 90.60 and eur/gbp keeps getting smoked.
in fact that eg long 85.72 from the daily is probably my favourite for the night.
all the best.

This sort of thing has been happening all over the place the last 24 hrs or so, ticks going just above then turning or turning then tuning back to stop me out then resuming where again.  :mad::eek:
The universe hates me!
Well thats alright cause I hate it right back.
Haha… then the universe hates me too cuz that happened to me today on the AUD/JPY
Then I missed out on a trade because it came within one pip of the convergence before it reversed, one pip!
man, I’ve been holding tight for t-money’s new updates but can’t wait anymore. Time to pick up where I left off. Gonna make this week a good one! I’ll try and post most of what I trade…
hi guys,
i haven’t taken this eg, but i thought i’d pass it on.

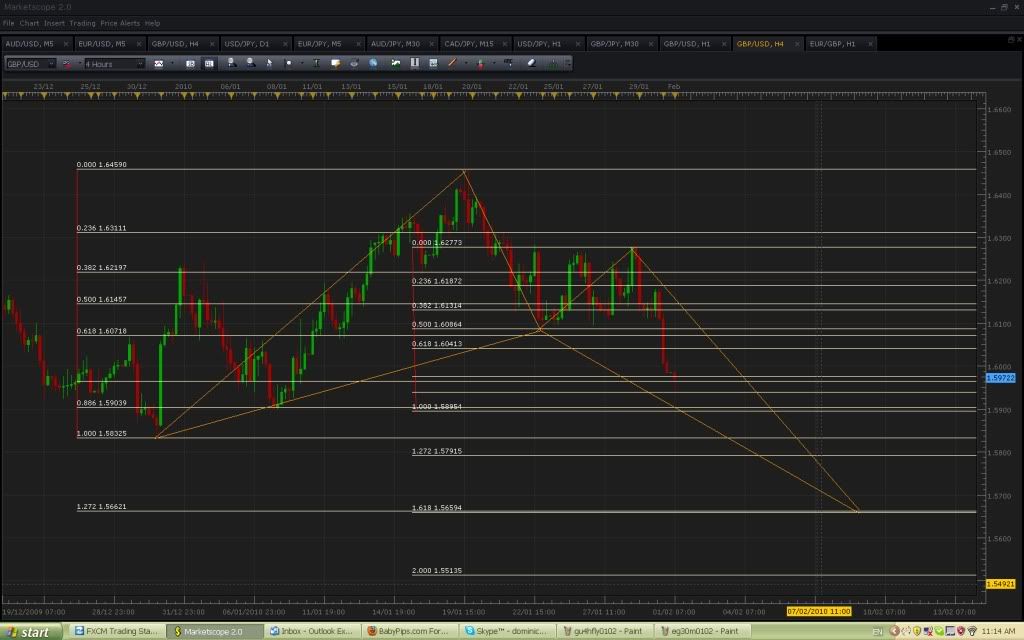
and this gu 4h is so far away it’s basically useless, other than to possibly give some confidence in taking/holding shorts.

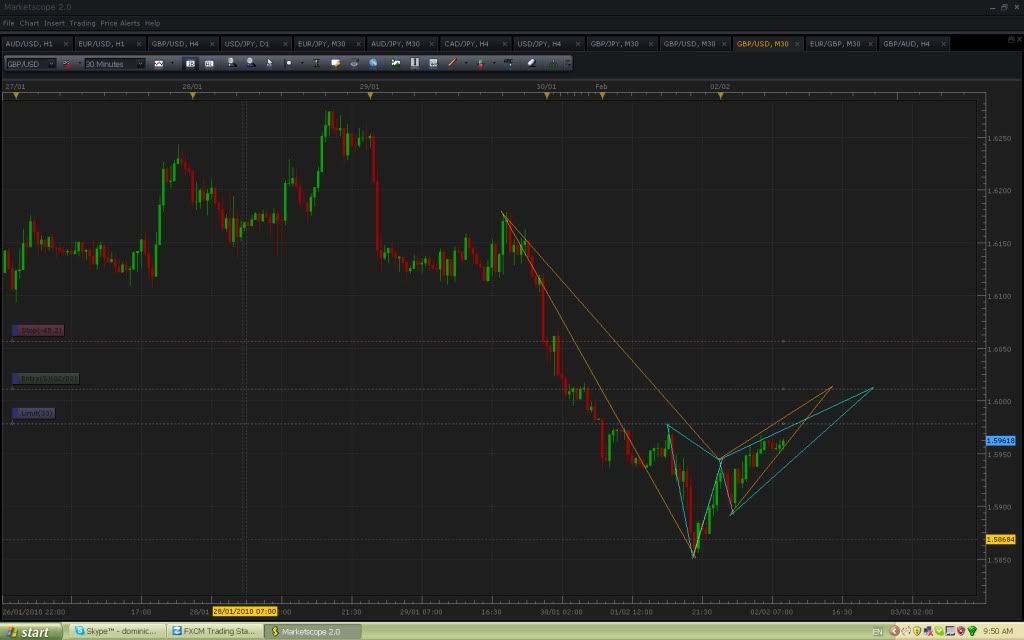
for anyone with a short gu bias, playing for possible failed gartley turning into bullish butterfly posted yesterday, here are two patterns on the 30 min terminating at the same D.
will play it by ear if/when it reaches D, but something to watch imo.

How do you decide where you pick your start of the impulse move? i’ve always been told follow market structure but im not sure this chart shows that.
thanks
doug
I take it as a swing high or low, or extreme in price. This can be open to interpretation, which is why i place more value on a patterns that arrive at the same D from different X’s. You will also get convergence at the same D using the most extreme X of 1.6276, however the B retracement is not greater than .236 XA so I have not included it.
So that’s my understanding but I am no expert.
Either way, it seems elementary now as the aussie rate decision has probably busted the setup.
Amen to that, I had three patterns that were close to forming "D"s, one within 20 pips and then they all went haywire!
Probably going to be a little while before any solid new patterns form
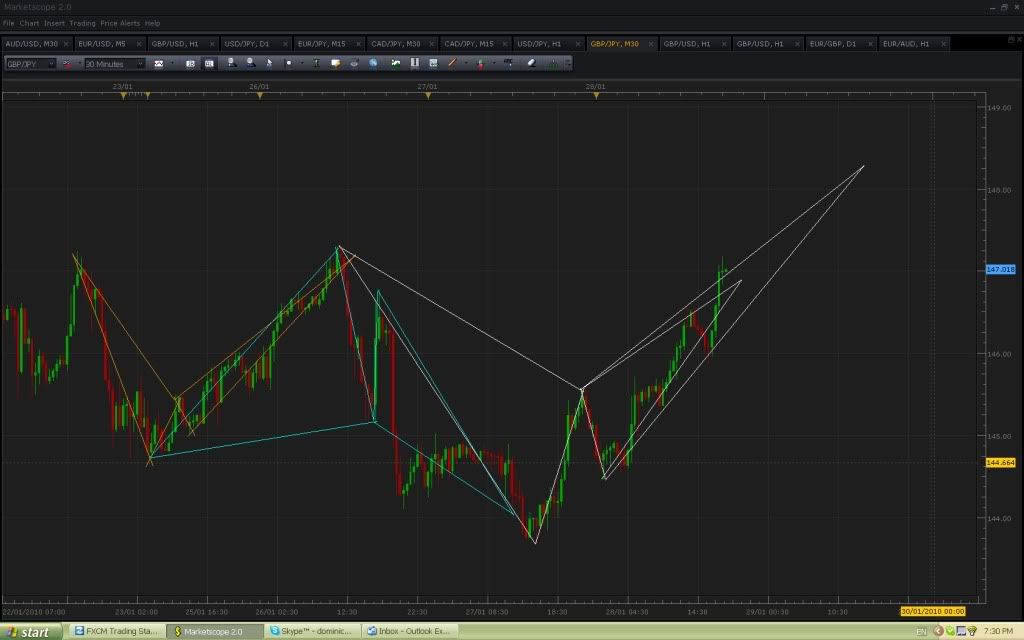
Here is what i’m looking at at the moment
The GBP/JPY is a little shaky but thought i’d include it and let you be the judge
Good luck!
racerdude777
Thanks for sharing these Racerdude. GJ is actually my favourite hehe, even tho convergence not quite as strong when on the ask.
All the best.
[QUOTE=modo;166483]for anyone with a short gu bias, playing for possible failed gartley turning into bullish butterfly posted yesterday, here are two patterns on the 30 min terminating at the same D.
will play it by ear if/when it reaches D, but something to watch imo.
not sure what to do, so i’m not going to take this, maybe a revised D at 1.6056
Hey guys, sorry I can’t post pictures for the moment but I have two bearish gartleys still on their way.
The first one is on the 1hr chart Eur/usd with D at 1.4025. This I like for a great ride to the downside. So far symmetry is good and looks like a good correction and on time of a previous 12345 downtrend.
The same goes for Cad/jpy 4hr chart, with D at 87.09.
I’ll try to post the images later.


