It looks like there’s a Gartley on the USD/JPY 1 hr getting a few convergence at 84.99 respectively.
Any thoughts on if this looks lagit?

I do see a semi-valid gartley on the EURUSD 5minute chart as you stated. But the convergence from XA does not match on the CD leg at 50%/100% It’s 61.8/100%
Is that ok? I’m still learning.
Now I get the opertunity to show my noobish here. Please explain what you mean by:
I wish I would have been looking at this 10 minute EURUSD earlier:
There was a beautiful gartley buy at that finished at 2617.
Well since you stated your X is 2720 you take the fib from 2720 to 2618.
which puts your B at just under 50%. You then take your B to A and move it up to where C is at and compare the smaller B to A fib in comparison to XA to fib hoping that the BA fib (100%) will converge with the XA to 50%. At least thats how I thought it was done.
I believe that the real X should be 2686 and A would be 2618, and D would be 2669 and it gets bearish from there.
I believe that 2589 is X and that 2720 is A in a bullish garley that already happened beautifully right before your pattern.
Possibly, I’ve just been looking at the extream for X and the next possible swing for A and B looked to be landing around the .5000 of XA with C landing at the .786 of AB taking the AB putting on C and 1.000 of C lands within 2 pips of .618 of XA and 1.618 of C also lands within 1 pip of .866 of XA
Just checked on other conformation, BC extension 1.272 lands right on CD’s target at 1.000

Looks like good to me, cant really see it though. We’ll see, hope it works out for you.
Not sure why the pictures keep shrinking there. I’ll have to figure that out later.
I’ve moved my SL to break even, most likely this might end up going down and utilizing the double tops.
My next move for this pair is sitting on the innitial 1.2580 short and 1.2720 long.
Here’s one which is ripe -
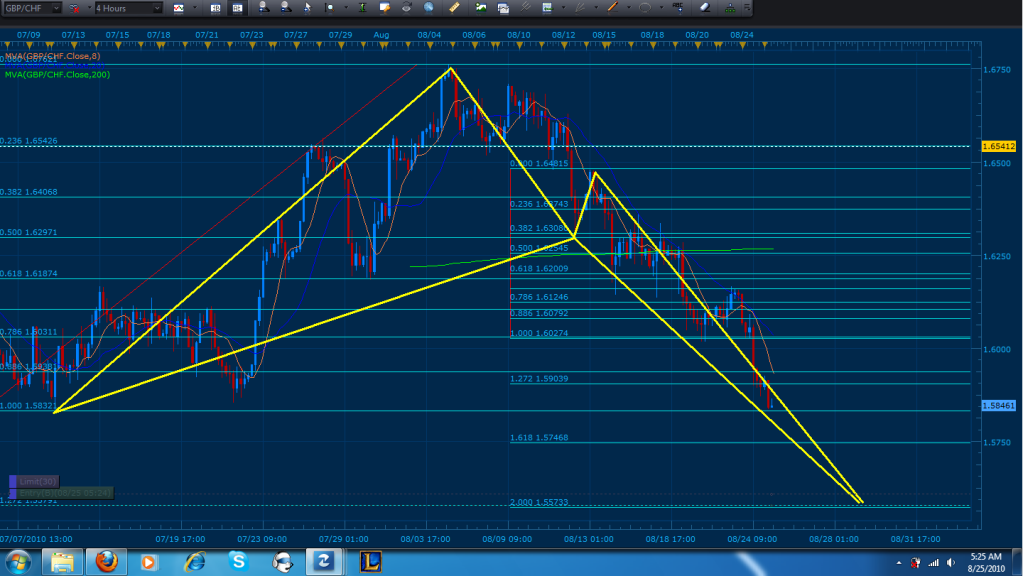
GBPCHF 4 hour, bull crab, rediculous RRR.
Stops below 5800 big figure, green lines are interim PTs looking for an ultimate move back to B.
I’ve already started scaling in.
Arghhh, I had a beautiful pic, need 50 posts to attach now!?!
X - 1.6170 (Jul 30)
A - 1.6757 Aug5
B - 1.6460 Aug6
C - 1.6705 Aug9
D - 1.5833 Aug25 (new D pt since I started typing!!!)
Hey it’s your trade, do what works for you. I’m in the same boat, except i’ll go short at 2620-2605, I havent made up my mind. and go long at 2700-2720 as well. If it breaks a certain resistance I think it will go in either direction, im feeling bearish though.
I didn’t know what a bullish crab was so I looked it up, but yours looks to fit 100%.
Congratulations on your trade, did you take profit?
Looks like I was right huh? Lol
img267.imageshack.us/img267/6960/potentialgartley0824.png
Accept i made no money! I knew I should of went long then shorted Lol. It looks like it passed your version of the gartley and turned into a bearish butterfly.
Yup, I had it all fibbed out ready to go too! 
D lines up nicely with prior S/R, with beautiful fib convergence PTs as well.
See how she goes…
Lots of movement right now, yen pairs and cad i’m in nicely!!
Be careful out there…
What technical books have you read that teach about the crab and other patterns?
Got my 37 pips there, now looking for this to hit 1.2870
I can very highly recommend Scott Carney’s book - available as a pdf from his site - you linked to him in your previous post. 
Larry Pesavento’s also ok and Leslie Jouflas (they co-authored ‘Trade what you see’) also runs regular free webinars on harmonic patterns. But I rate Carney alot higher.
Lots of advanced stuff which can be incorporated too but that’s for later… eg. chaos theory
Congrats, prty risky move though IMO. The only legitimate D point with proper convergence and such that I see their is at the 1.272 and 200% CD (C being 8/13 1am 4hr). If I where to use the X you have drawn for the crab pattern, my D would be off the convergence by 58 pips or so. Anyways, the 1.0 of the most extreme X (Illustrated bellow) seems like it can hold the pair for another bounce. At least to retest the area where you guys initially took the trade or the .886 it broke without testing. In other words, if it respects the current zone expect a 90-100 pip bounce that should form a pattern on the lower time frames for a sell and continuation of the trend. If the pair breaks the 1.0 (lowest low 4 hour), then the pair should drop for another 237 pips before any decent retracement gives way. All and all, good luck on your trades.
Hi TMB and crew.
Came across this thread a couple of days ago, and I find it very interesting to say the least.
Being new to this system, I thought I’d post a chart to see what feedback I might get. Would love to hear any comments.
TMB
Must say, thanks a million for your willingness to share this information and your efforts in helping others. To be highly commended sir 
