Wow…you’re awesome TMB! Thanks for the videos, and I’ll view them as soon as I can tonight!
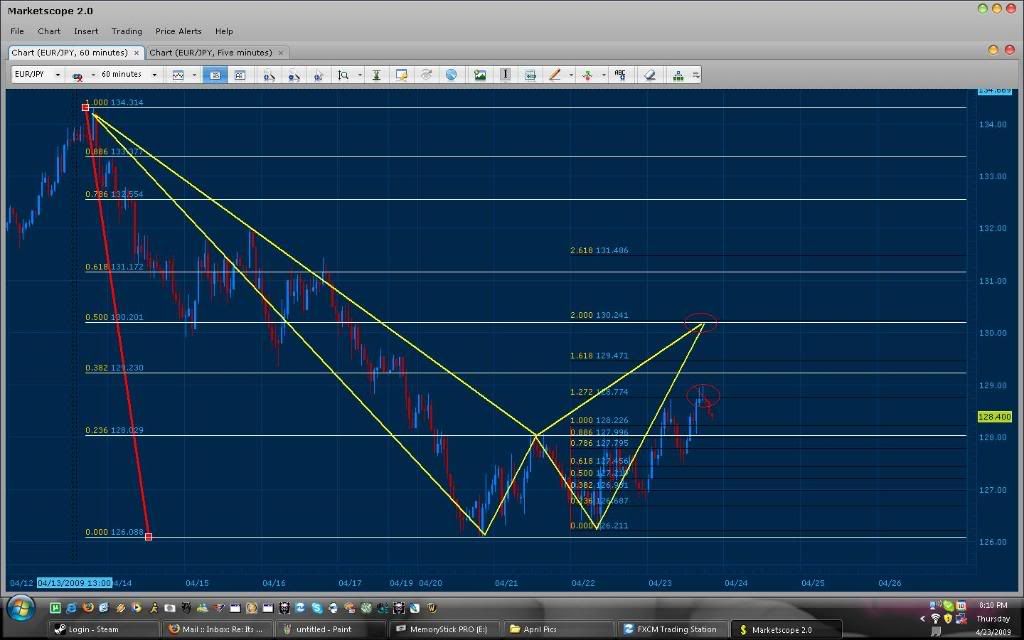
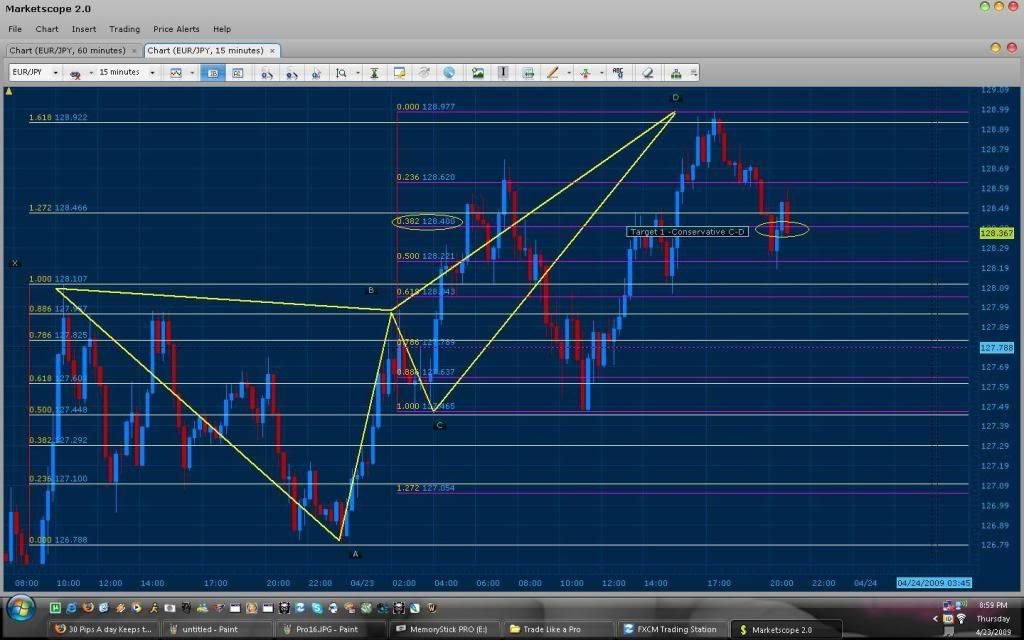
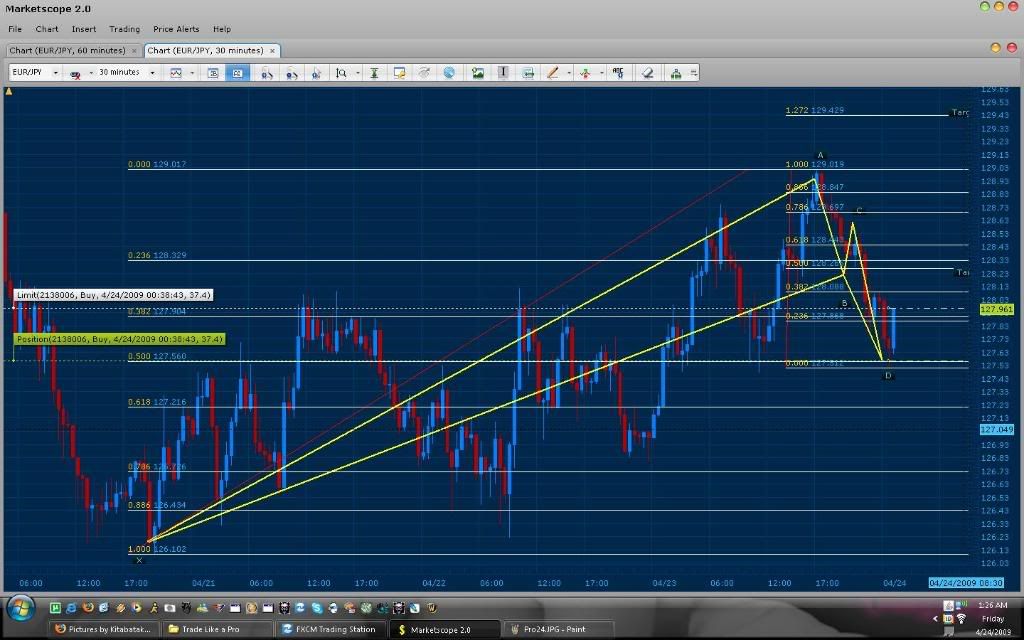
So without that guidance, here’s a bearish butterfly pattern I’m seeing in developement …if price reaches D at 129.10, then we’ll find out…lol
Update: Well it didn’t quite reach 129.10…10 pips short as far as this chart is concerned, but down it went anyways. Don’t suppose you would have traded it as you stated it had to be at most 5 pips away.
I’ve added a 2nd more recent chart which shows the pink trendline of the gartley’s D leg and price is hovering around it.
I take it this is a good time to check for candlestick patterns. Seeing a couple of spinning tops/doji’s… maybe an evening star developing? If it breaks it down, then basically it’s a valid butterfly, if not then it’s a failed butterfly (although coulda been a little profitable), and the gartley’s still a possibility.
Am I reading this all right?..lol…I hate seeing things after they are all complete cause that’s not what goes on while one is trading.
Price is almost at D for the butterfly, however when I zoomed out my chart, suddenly I saw a possible gartley. Now if it’s a gartly, then we’d have to wait for price to reach 129.53. They both suggest price will go down, but from where…lol
I suppose if I read the book, watched your video etc, I’d know, but this is fun in the meantime…lol
First of all X must always be at an extreme in price and the A must form at its next swing. To clarify, refer to the image bellow which shows the true pattern for where you are wanting to Define X from.
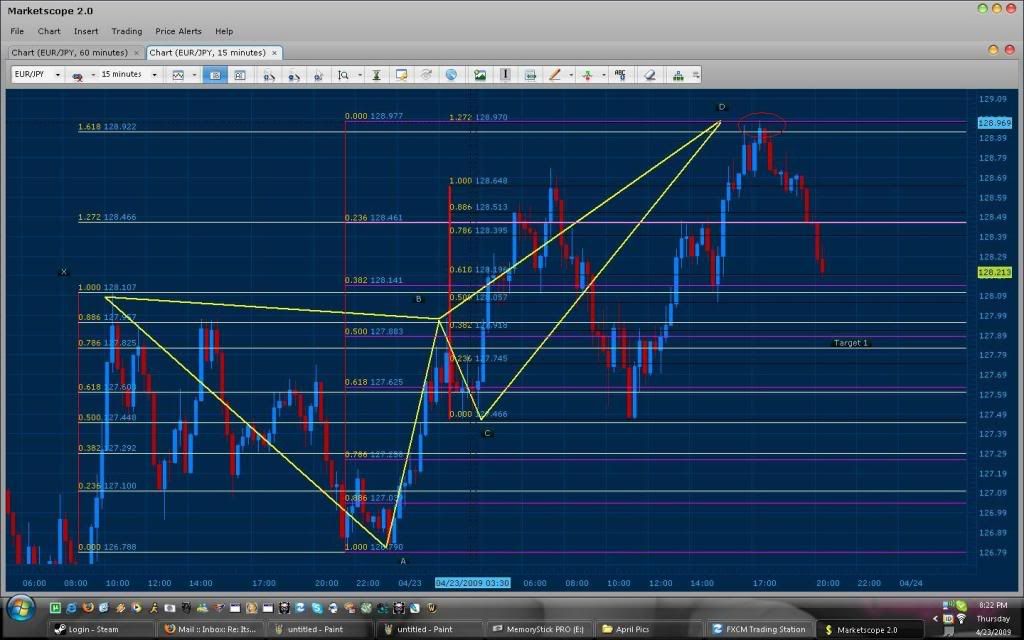
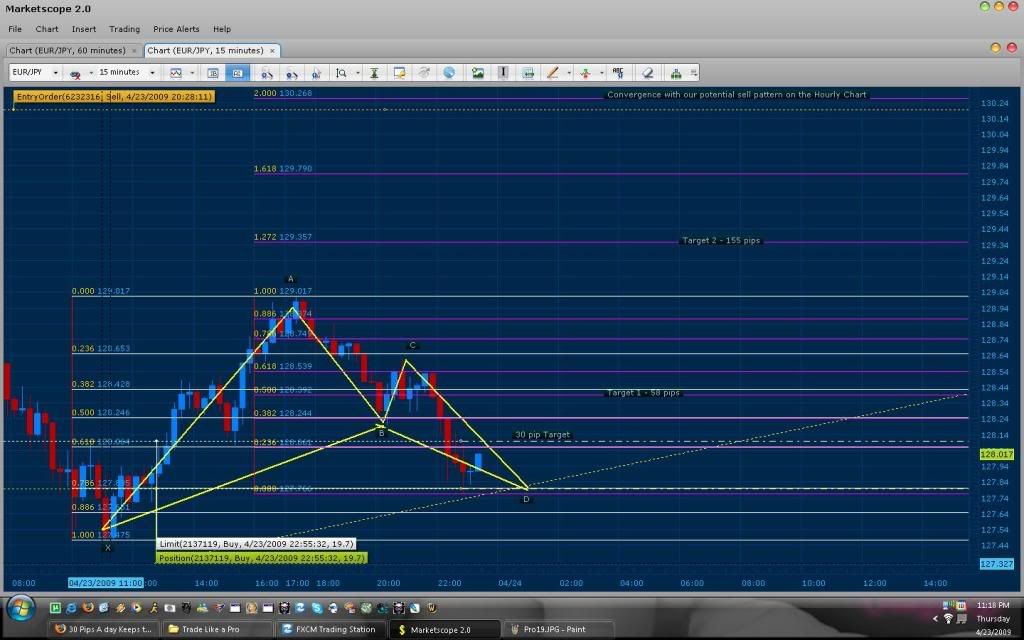
The true convergence of this X and the ABCD occurs right at the .500 of XA and the 200% of CD. A beautiful upcoming pattern which I will set a Sell Entry at 130.201 of price. The Bounce that happened at 127% of the C-D Leg was a fake out on the Hourly chart. But on the 15 minute you came close to finding the pattern. Bellow you will see that price created a pattern representing the fake out of the hourly on the 15 minute which could have been traded with proper risk management.
As you can see on the 15 minute, the 127% of CD converges with the 1.618 of XA. The issue I have for this is that the 127% is above the Fib level making it more of a “dangerous” trade this is because of the fact that your failure point will be above the 127% close a decent amount of pips after the 1.618 XA fib level. All and all, the pattern worked and it seems to be heading towards its first target. In addition If you would have taken my advice and set the limit to the .382 of CD you would have limited out and avoided any future fake outs.
*Tip: The longer you are in a trade the higher your risk loss %. This is because price becomes comfortable with the levels it “continues to test” and can easily switch directions…
Edit: As you can see bellow a conservative limit, setting your target at the .382 of CD has been hit.
-Edit-
Looks like our trade is coming through In addition, notice how the 200% of CD converges with the possible hourly pattern that is developing. If this trade goes through and continues towards target 2, it can then me used as extra confirmation for our upcoming sell.
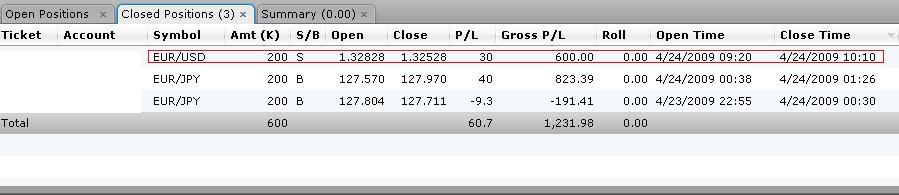
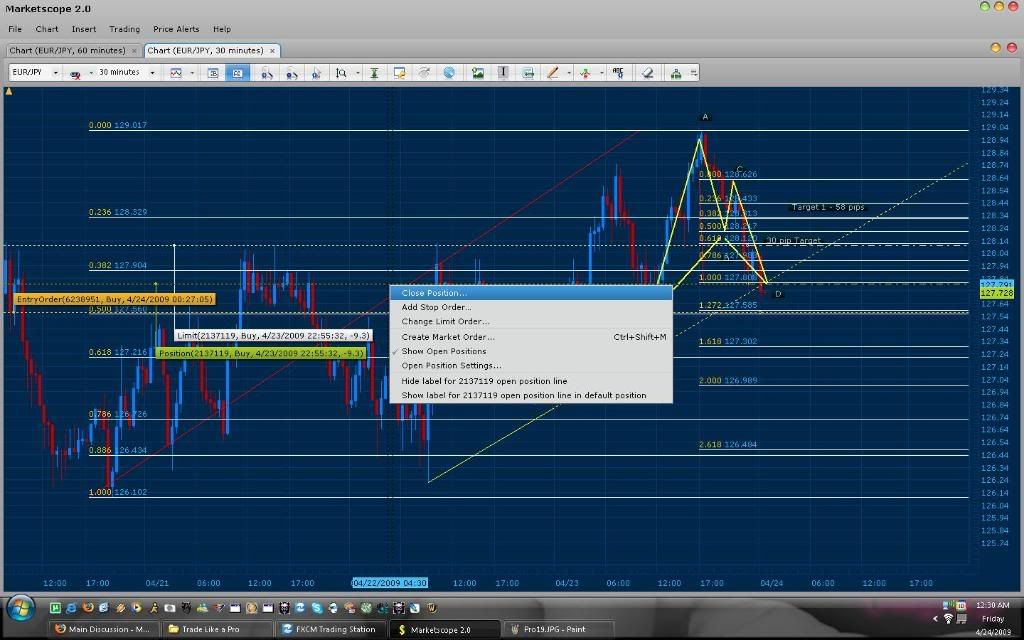
The trade missed the 30 pip limit by 3 pips (reached 27.1) and tanked down.
Understanding the failure:
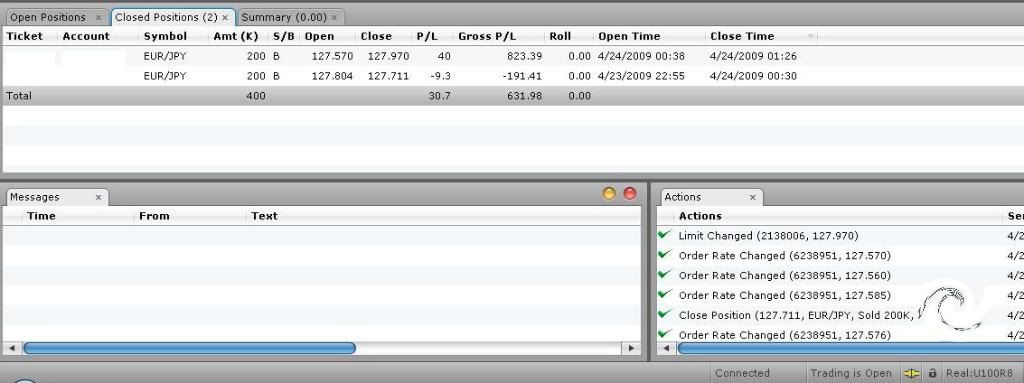
The fact that I did not choose the most extreme point for my X on the 30 minute chart, did not allow me to see that there was a major .500 fib level with convergence at the 1.272 of the current CD leg. In addition If I would have placed a stop to break even when I had gone positive I would have avoided this -9.3 loss. But as to sticking with my trading plan, I will not close out a trade until it closes bellow the fib level where my entry has been placed (Although the use of break even points are highly recommended).
Although the initial D point failed, the correct D is still valid. As a result, Do not give up on a trade! Yes you lost some money or you broke even, but do not blind your self from the next opportunity which may be just 5-10 pips away.
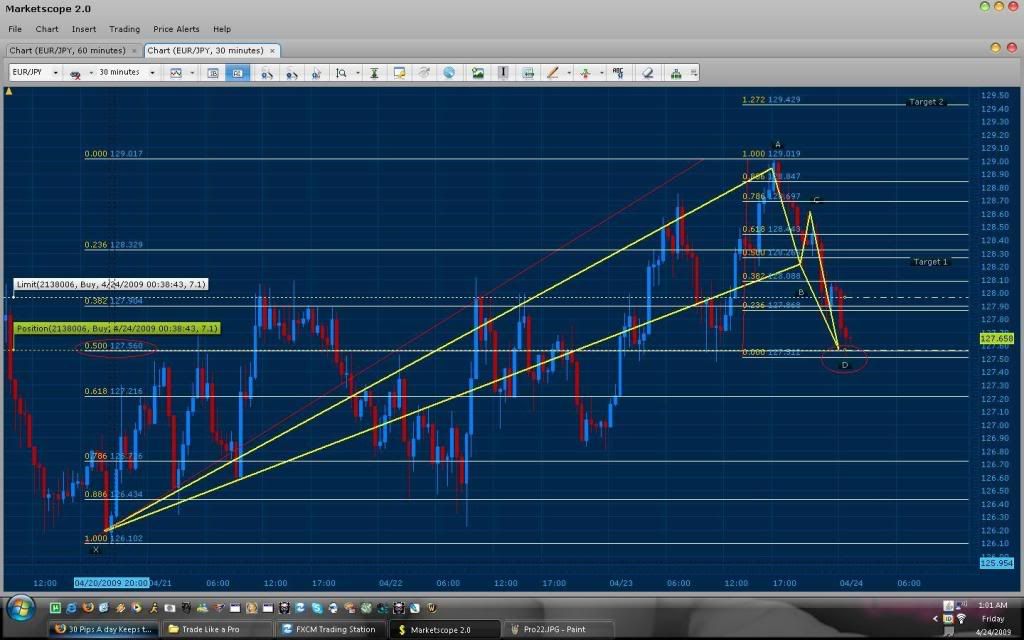
Trade start at 127.57 Right on the Major .500 Fib level of XA our target is set to 127.97 for a 40 pip trade making up for our earlier loss and giving us the 30 pips for the day.
There is convergence at the .500 of XA and the 127% of CD
The new trade was the “true D” and has allowed us to recover today’s loss and close with 30.7 pips for the Day. Pip gain from Prev. trade = 40 pips
Lesson for today:
Always do a full analysis of the market you are trading before entering a trade.
Accepting a loss is key to being profitable.
Never give up on a trade.
Realizing and remembering these 3 things is what allowed me to continue trading and realizing today’s profit. Controlling your emotions and not giving up is key to becoming successful. If I would have gotten mad or cried about my loss, I would have never seen the potential gain that was available 30 minutes later. Always keep in mind that you do not control the market and it is YOU who decides when to enter and exit the trade. This means that YOU gave your self that loss or YOU gave your self that profit.
I’ve been so used to mt4 charts that it feels weird working with Marketscope’s charting, but I did change my fib levels, and now I can also put the xabcd labels on too…oooeee…lol.
Thank you for posting the links for me and yes of course I use price alerts. To be honest my cousin who works the London and NY session sets them for us. We usually place them 20-50 pips away from our estimated entry. They are very helpful in our case for remembering daily patterns that are developing or big hourly-4 hour patterns. As for trading platform, I used to use Forex Live Track 'n Trade… but the stability and memory leaks from software as such are just too much to bare. Keeping things simple with market scope saves me time and ram. Which is why I figured that you can use fibs instead of the 1 2 3 or abc tools other programs provide heh. As I stated before, I only use Fibonacci, Trend lines, and Candle stick recognition. Theirs nothing else you need imo .
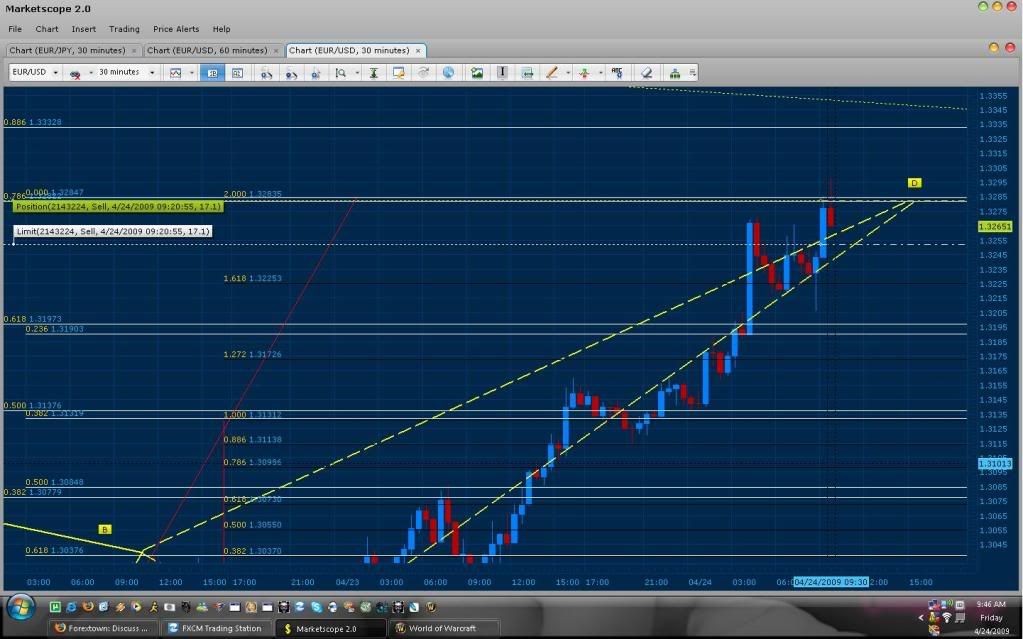
Looks like we may have a major turn around for the Euro dollar today. Possibly a reversal to test this weeks price (Remember Friday is “test day”).
Bellow You will see that the EURO/USD has an XA convergence at the .786 with 200% of CD. In addition, the BC leg was only a .382 retracement and as you can see the CD leg did not respect the 100% level nor the 127% (there was also no convergence in these areas). Lets see if this trade ends up going through to at least give us 30 extra pips for the day.
When Doing a higher analysis of the EURO/USD, it looks like the “true D” will be a bit higher in price. In fact, the convergence found bellow is more at around the 1.34 area seems to be the Major Trade for this pair (the one every one should be waiting for). I strongly recommend setting your price alerts before it reaching that area. The entry that I have mentioned above is still valid, but will most likely fake out and try and reach this upcoming pattern. In addition please note that I changed the BC in the pattern bellow to the swing after the BC leg used on the pattern above. As a result, you can notice how now their is a reason why price is having trouble moving up at the moment since its “flirting” with the 127% of this CD leg. What I’m expecting to happen is that price will push through this 127% hit our entry at 1.32828 and probably close bellow the 127%. If it closes above it on the 15 or 30 min. ( above 127% of cd instead of the .786) I might close out the trade and wait for the bigger pattern to form.
Looks Like our trade is coming though. This is a beautiful wick the market has formed on the 30 minute and is a good indication that this can reach target 1 of A-D (.500 Fib = 188 Pips)
Thank You all for your reply’s I am done for the week and will see you all on Sunday. I will still be on the forums and answering any questions you may have. Our last trade was a success and here are the results for the day:
You explained how you disect the XABC points and validate them with the fibs, and from that project where D should be to complete the pattern, and then wait for it to reach it. But before that, what do you look for to start that process?
Also, the general references on the patterns always talk about the symmetry of the triangles and/or ABCD lines. I wouldn’t say the gartley 222’s triangles are symmetrical…lol…since the one triangle is usually stretch out so much more than the other. And sometimes the ABCD lines aren’t either where the AB line slants slighly different from the CD line. How do you find that affects the success/failure of the patterns, if at all.
Yes your correct, the majority of the patterns we have traded this week where not symmetrical at all! The way the market has been behaving for the past 2 months has been extremely irregular which is why their has been this lack of symmetry. This is the reason why a lot of the patterns have not been reaching their usual 50-60% retracement which you would see in normal market behavior. So what do I look for when the market is "wack"? Well instead of symmetry within the ABCD I look for symmetry between the "zig zags". To clarify, I make sure that the pair I am trading has a history of patterns. This means that I would go back about 5-10 days into the chart and make sure that one pattern turns into an other and in to an another and eventually end up towards my current time. Which is similar to what I did in the tutorial posted up on you tube. As a result, all the trades I had made last week except for the last EURO/USD trade where on the EURO/JPY. This is because of the fact that I found it to be the pair moving with the most "symmetry" this month. But even as that you notice as well that a lot of fake outs have been occurring. In effect leading to another reason why I try to only "steal" 30 pips from the market and not go for that tempting 100-150 pips that the pattern potentially gives me.
Oh and to quote: wrtm_19
Looks easy and pretty effective. Thanks for sharing!
Reader on!
Heh yeah it looks easy, but to be able to trade like this and to see the patterns the way I see them (which just pops out like an image in any chart I open) will take you a lot of practice. The most difficult part about this form of trading is greed IMO. This is because of the fact that if you trade to target 1 as indicated in the book (.618 fib level) you will have an 80% chance of being correct and reaching 70-150+ pip goals for every pattern in normal market conditions. Which in effect give you a "god like" complex believing that you in the end know it all and know exactly where price is going! Which is wrong and the number 1 mistake every one will make... and believe me you will make this mistake once you get used to it. As I stated before this is the reason why I restrict my self to 30 pips and restrict my self from feeling any emotions what so ever when trading the market (based on 30 min trades). In addition, finding the correct D and the right pattern to trade will also be difficult. But atlas once you do get the hang of it and learned it to the point where you see butterfly patterns and gartley patterns in any zig zag you see in life, then you will master it and it will all be easy as pie. :cool:
A friend of mine asked me a question today:
… One question I dont see mentioned. You mention leveraging high for the 30 pips only. What % of your account are you risking per individual trade. I am guessing with a higher level of experience and education one can tolerate risking 10% or so of equity (this seems extremely high to me though) if they know that they have an average win % of 65+ over 100’s of trades. I notice that you close out a trade for ~10 pip loss. Thanks again.
Throughout my progress I am risking an average of 5-10% of my account as I increase my balance and move on to the next leverage increase. I do not intend to risk more then 10% of my account at any given time (90% margin available at all times). As for the win ratio of 65%… well this weeks trades actually averaged out to a 75% positive trade ratio. 12/16 possitive trades (this is not counting a full 30 pip gain but the fact that the account did not go negative more then 4 trades this week). As for pip loss, in trading this method [U]I should[/U] be placing stops close enough to my entry to at least cover the spread as soon as I reach a positive range of 10-15 pips. This is something I typically do when trading any pair other then the yen pairs. The reason why I much rather wait for a close “bellow” my entry (fib level on a bullish trade) is because the Yen pairs tend to “whipsaw” frequently and would stop me out in 2 seconds then return to its base price immediate. Waiting for a close on these pairs makes me as a trader more comfortable. In addition knowing that every pattern has an 80% chance of completing to the .618 in normal market conditions, greatly increases my odds as I only choose patterns which have good “convergence” and in markets that are symmetrical. Now as for showing a full win/loss ratio, lets wait until I show you all a months worth of trading patterns before judging the percentage completely and not just base it off the few trades that have been shown so far.
Hello TMB, So far I consider it as one of the best methods to trade, let me explain why. I think risk reward ratio is always better than 1:1 right? This give us a chance to trade more lots and hence make more money. So far I haven’t seen such a method.
It’s really easy to understand what the whole thing is about, even when obviously I’m gonna need a lot of practice to do it right, by looking at your charts I understand exactly what you’re doing, and this does not happen with other methods where I need a lot of time to figure out what’s going on.
The last and the better, you’re so clear in your explanations that it’s like learning what is 2 + 2, you don`t let anything to guess or to doubt.


 Let’s get the links back which were removed due to your post count…you need 50 I believe to post links