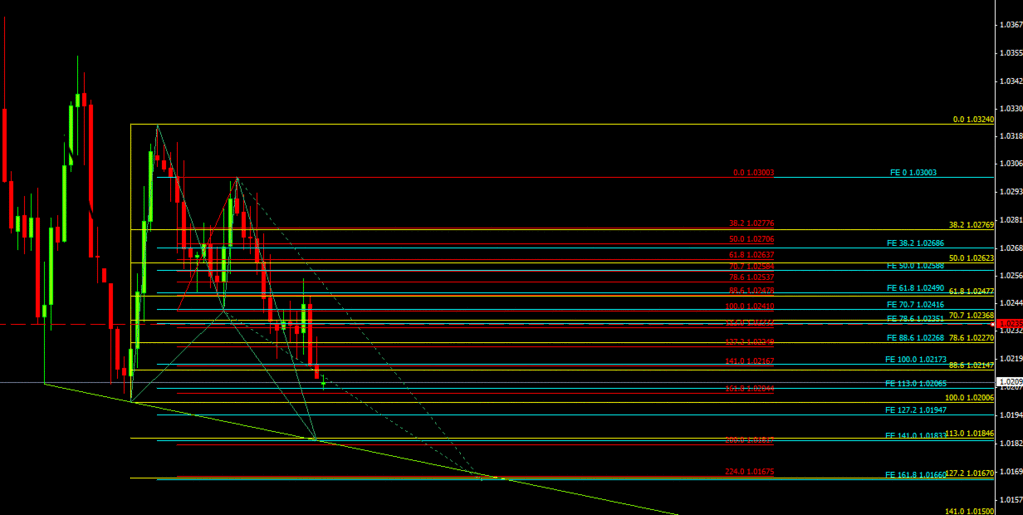
By the way, the 1-hour’s retraces and expansions tell us that it is more than likely going to move straight up.
It is currently 4:52 AM where i reside; therefore, if I have missed anything, please conjure.
By the way, the 1-hour’s retraces and expansions tell us that it is more than likely going to move straight up.
It is currently 4:52 AM where i reside; therefore, if I have missed anything, please conjure.
The 1 hour pattern is possible, but consider also the next possibilities.

Due to a “predominant” downtrend lower lows could be forming…
What timeframe / pair is this?
The predominant downward trend is exactly what helps the short to be placed on the grey 222 pattern I drew. As soon as it becomes lower than point ‘A’, however, then it will simply be invalidated. Until then, I’ll wait for confirmation signals
It’s USDCAD 1H
N.b. Sorry to all who have been following my ‘daily’ chart art/ideas and haven’t received anything this week. I will be trading and sharing ideas as soon as I am in possession of my macbook which is currently under repair.
It actually hit the 1.272 Fibo Level and retraced
That one was pefect. gj
I have one for the USD/CAD 4HR
what pattern rules are being followed in the pictures you have posted?
update:
1.the orange 222 was triggered & gained +30.
2. the grey 222 is invalidated.
New formation that has been taken long but yet to hit 30 pips:
(USD/CAD on DAILY)
X: 22 May,
A: 3 Jun,
B: 11 Jun
C: 11 Jun (since the market opened low, then closed high on this day, it is valid)
D: 19 Jun (61.8 expansion of AB=CD) <-- this does NOT validate a ‘true’ 222, but a scalp move has been taken.
-----True 222 would be a minimum 100% expansion = 1.00829… but then that woul dmean price would have to move lower than ‘X’, which, in essence, invalidates it.
keep the support and thread going! these inputs is what will happily pad our accounts
PJ
GBP/JPY 1 Hour;
X: 12:00, 15 Jun, Value: 122.128
A: 0:00, 18 Jun, Value: 124. 636
B: 08:00, 19 Jun, Value: 123.243
C: 15:00, 19 Jun, Value: 124.516
D(??): Value: 123.123 (100% expansion of AB=CD)
Position: Long. TP: 30 pips + Spread. SL: 122.990 (below 123.0 psych level)
I am not positing with pictures due to the inability to take screen shots on this temp computer.
Happy piping!
PJ
HI ,thanks for the explanation .
Is the AB=CD always true ? I mean is it never 2AB= CD etc ?
Also dont we have a valied bearish gartley on EUROUSD on H1 chart?
Nice work. I am still learning to trade harmonics.
Hi there,
Happy pipping to you too, I hope you are now able to post screen shorts with your analysis. It sure does help to see what your analysis is based on.
thanks
Finally, a new computer is ink possession. I’ll read the input from others and post pictures/explanations
there sure is–good observation. I have posted my predictions a few pages back at;
301 Moved Permanently
Were you looking at a nearer-termed pattern? mores specifically, where do you believe the ‘X’ is?
Follow up:
we can see that it did not hit our 123.123 target but the strikingly perfect 4-hour ‘pin bar’, or long-wicked hammer, at the 61.8 expansion retrace told us that it will turn around prematurely on this 222.
4-Hour view:

X:124.770
A:125.751
B:125.081
C:125.520
D (??): confluence at 100% expansive retrace and ‘typical’ D of XA retrace: 124.882-124.870
NOTE: i will be looking to SHORT if price moves (UP) to 125.7 due to the LARGE amount of previous resistance and fib levels.
However, if this pattern completes, i’ll be looking to go LONG at point ‘D’. The lower 30-min time frame tells the wise trader that he or she will to wait for an almost perfect 222 to form.
Just writing to say Hi, and that I am excited to join you in pattern trading. I have been reading scott carney and practicing identifying harmonic numbers in the charts, some ABCD patterns, not quite far enough along to look for animals but… I will try and follow along!!! Do any of you have a blog based on pattern trading?
cheers
Jongp2,
Maybe im wrong but i dont see any ab=cd, isnt it more likely to end up in a crab pattern ? It would work…
NZDJPY 60min. Possible pattern. If price exceeds B point, chances are retracement occurs at 100% Fib expansion (close to the trend line) .
Welcome! And an excellent blog would be the one you’re currently on–especially due to multiple views and inputs