I entered at 119.698, got in a bit early but I got 37 pips out so far, I think I’ll close the trade although it’s so tempting to stay in because a pin bar is about to form. Good call TMB, this is very educational! thanks
lol, practice practice practice 
The USD/JPY hit the bottom of its channel and is currently halting from it. As a result I’ve booked 60 pips from the EJ; I am reversing positions at this point until a break happens and will be reselling at the retest of the bearish pattern.
Major news is coming out in 10 mins and the 8/4 hour charts have closed bullish which is my reason for reversing at this point. The fact that the daily chart has been showing signs of a downtrend at the start of this week is my reason behind entering at the retest of the pattern. As stated previously we should expect major flags to form across the pairs and/or breaks.
at what price exactly are you going to short?
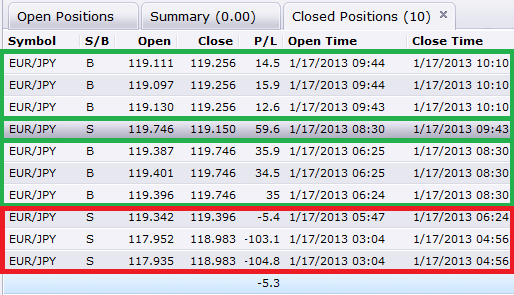
I committed the novice mistake today of not placing a close physical stop on my trade after stepping out of my office thinking I would be back immediately. Three hours later, I come back to see that my emergency stop was hit and was 100+ pips down… Funny how yesterday we spoke about stops here lol, but even funnier is the fact that my wife handed me a quote from a calendar she had and told me to stick it on my monitor (women most definitely have great intuition).
The quote is from [B]Richard B. Sheridan[/B]: “The surest way not to fail is to determine to succeed.” This definitely helped me today and allowed me to commit to the following recovery.
Actually im too tired to continue trading right now but I anticipate short again at 119.741 a close above 119.813 as my exit (hourly/30 min close will suffice); a break of that convergence means that price will push towards 120.603-121.0 range and a buy towards that higher convergence would be good. Apart form being tired, I do not like the current price action in this market it appears that the EJ may separate from the EU for a bit with the given news. As a result, wait for these points to hit or for current price to break 119.095 before continuing the short.
Again, please leave any questions you may have and I will get back to you all this evening.
Happy Trading.
Impressive loss and even more impressive recovery! 
That screenshot alone is worth a lot of $$$ and makes me realize something, I’m probably not nimble enough with work and all to do the buys that you did today, so I’ll stick to the big anticipated levels for now. One step at a time.
Thanks for all the insights today, take care.
Cheers
any one taking the EJ short?
Nope. Still firmly above 119.
“Vi veri universum vivus vici.”
I’m going to attempt this short, the 5 min just hit the 1.618 of the daily at 120.013 of price, created a double top off the exact fib and broke the 8 mva for the confirmation. I will read the current market movement as exhaustion bars and wait for the daily close to exit the trade or a bullish close above the previous high.
I thought a long towards 120.60- 121.0 would be the way to go if that convergence failed?
Hello fellow traders 
I am relatively new to the whole harmonic trading method. I have read Pesavento’s book as well as read like the first 50 pages of the thread. I must say it is very awe-inspiring and amazing to see the method actually work. I also like the fact that TMB didn’t leave the people out in the dark despite having the method perfected for himself. Good job man
So I decided to give it a shot myself. I have spotted a potential bullish butterfly forming on GBP/USD pair. I know the candles for the fall are yet to form but if they do please tell me whether it’s valid. Cheers

Guys, what do you think. Did i get this one right?
GBPJPY, 30M/1H Chart
Convergence at XA 2.000 and CD 0.886. I know i didn’t take the first leg for B but it wasn’t a clear leg for me so i took the one which stood out visually.
Price directly started pulling back from that level. Time will tell if it will work out or not.

Just got in on the EJ at 120.19 short. Looking to exit moderately at 119.374.
EJ is on it’s way. Let’s see if we’ll hit our target. I also just took the Aussie for 27 pips from the H1 gartley.
Just saw this, worked out very nicely I see.
Call me crazy, but I reckon that a major top has just been put into place on EUR pairs, especially evident on EURJPY and EURGBP.
EURJPY has formed a perfect Butterfly pattern with the failed Gartley and 127% retracement of XA which indicates just that - a new top.
I’m short
PS. This move has the potential of a couple hundred pips so I would love to hear your thoughts on it, TMB.
How do you figure. Even if you are using an 8 SMA, as TMB understands the mechanics of. Price never tested the 127, and the pattern is only evident on the 1 hr tf and just barely with bad convergence. I would rely on wick to wick fibs as that is what I know some other traders rely on. If you look at the more major tfs, you can expect price to test 121.10 and probably more likely 121.98. I would look for buy patterns at this point.
Hey there,
This screenshot explains best.

You are correct that it’s not based on daily and bigger timeframes, but this is a clear setup the way I’m looking at it.
Cheers
take the bullish setups that appear until 119.75 is broken with force (preferably an 8 hour or daily close). Yes the pair has hit a bearish pattern where the .382 (120.603) of XA and 200% CD (119.128) convergence has been triggered and respected it in the lower time frames. because of the fact that its a monthly pattern, price can still push way past through the convergence before fully respecting it and sparking the down trend. To clarify, if you open your monthly chart and look back at previous price history 119.74 was a previous bottom and the last time price tested this zone price pushed up towards 123.300 before closing as an inverted hammer.
Please note that since the start of this thread I have been trading the EJ… (in fact its the pair I traded on my first post here). Trade with caution and only trade the extremes of price if you are going to work with the yen pairs :). Also keep the USD/JPY open and the EUR/USD charts as well for both govern the movement of this pair. In addition, today’s GBP news has effected the EUR/GBP significantly for a bullish euro.