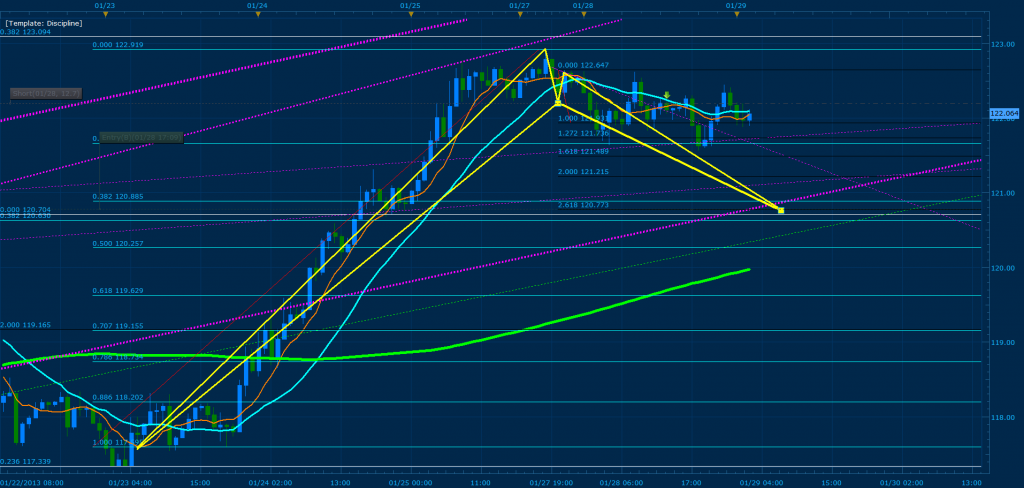
Short EJ unless price breaks 122.280. Selling towards 120.777 where a buy entry is waiting for me. If price does not reach this zone by 1am EST tomorrow, I will reanalyze the parameters and post a new entry point. Convergence zone for this buy is the price range of 120.887-120.542; If 120.542 is broken then expect price to reach 118.0 Price range. Please note that the two previous highs act as our C point(s) in the hourly chart. I will not post a graphical representation of this possible development until the London session, but I will hint the location of the D points and the CD percentage. The bullish entry that awaits me lands exactly on 261% of the first swing and 120.542 of price is 161% CD :).
I’m on the same short as you with the same stop and pending buy. I think there’s still some downward movement to go before we can look to any buy setups at the moment.
Me too, i’ve been watching this pattern for a few hours. Just took the short position though, I was waiting for it to break down from 28/01/2013 2000 hours low before going short.
Glad i’m finally begining to see what you are seeing TMB! Thanks again for your contributions!
I see the convergence at 161%, but if that’s the buy, then what is the bullish entry at 261 imply?
Just to be clear, you are all shorting the CD leg now?
I’m not sure what Tmoney means by the 261%, but I see great convergence at 50% XA at 119.98 from the 1/23 low and 2% from CD extension.

Is this what you see for your entries?
Bearish butterfly, 161Cd converge with 168.8 XA, which also converge with 0.382 of the weekly fib.
Bullish pattern 161.8 CD converge with 38.2 XA
How do you figure it out that if it falls, it will reach 118.00 price ranges?
Nice work! Keep it up buddy
I believe that is an accurate Gartley, but by TMB’s rules, you should use the 7 day average as your X for longer timeframes. I tried both ways and the current wicks and candles are respecting the MVA X slightly more, though the difference is minimal.
There is a ton of convergence around 120.687, which is slightly above the 161 for the CD.

On my graph the 2.61 of the CD converges within a couple pips of the .618 of the XA, and also two other fibs, so that should be what TMB is referring to as (a second?) entry point. However, that is still well above 19, so I don’t see why a break would skip that level and go straight to 118. As for the 118 target, I believe that is because you can see that 18.3 or so used to be a major resistance before the uptrend began, and also has excellent convergence, with XA, though not with my CD. It’ll be very interesting to see how this plays out. 
What do you mean? I cant recalled that TMoneyBags mention this anywhere.
He’s mentioned it a few times this year, and you can see it on his graphs. The most clear explanation is his post here.
I read that post couple days ago, and understand it, but you said, “7 days average”, I’m not getting what you are saying.
The 7 day moving average. You have the line on your own chart, I believe.
Oh you refer to the MVA that TMoneyBags mentions. For that, we don’t have to use it all the times for X. In this case, I believe wick to wick is better in my opinion.
I tried again and see it is matching the latest move of the price. It also matchs what you place for long. But I still dont get what you meant “lands exactly on 261% of the first swing and 120.542 of price is 161% CD :)”. What do yo meant 261% of the first swing?
Could you possible to post analysis along with picture for this. That would be a big help.

Just use this marketscope again for this analysis and I must say, I fall in love with it. Doing thing in marketscope is faster than in mt4.
Interesting. Since i’m searching for patterns sometimes at work before i go home i apparently found this one yesterday on the EJ (convergence 1.618/0.236) which would have worked out great if price would’nt have missed my entry point with 3 pips. 
Good practice for me finding patterns, forgetting them until i get home and finding new ones and sometimes the same. 

Have a nice day everyone!
Bellow the bullish pattern that I am seeing develop towards the extreme of price where 261% CD converges with the .382 of XA ( when using themost recent low MVA curve as X) on the hourly chart.
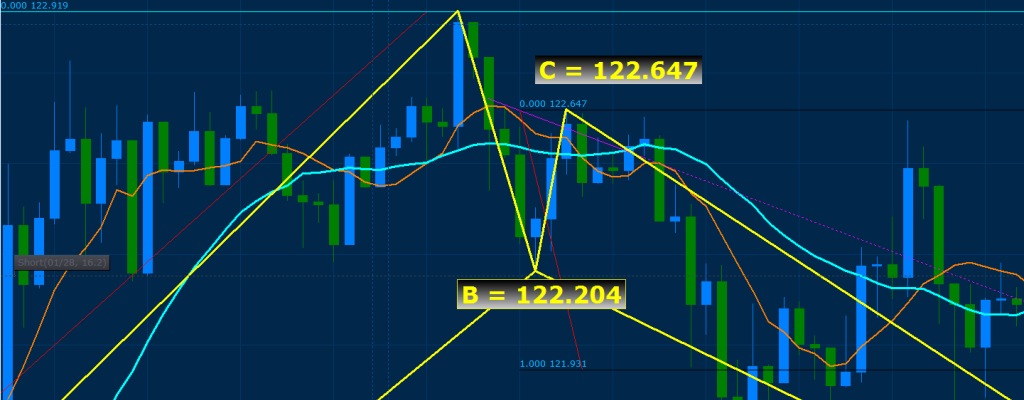
My eyes are trained to see these patterns at a glimpse… even when the CD isn’t as clearly formed in its highest time frame. As a result, bellow I’ve zoomed into the 30 min chart and placed the coordinates for B and C to make finding the 261% CD extreme I am using easier. Now you can see the first swing with ease…
Is there anything to be seen at the moment on the EU? I’m still just fumbling my way around but I see what looks like a fairly nice bounce on the B off of the 236 fib and possible convergence on for the D at the 382 of XA?

Crap, thought that AB had to be at least a .38 retracement of XA and ruled out that swing, but going back to the Rules it’s just the BC. Misread on my part. The numbers make sense now, and I can see the 161 is already hit. Oh, well, already took 30 pips off that even if I didn’t quite understand it, so I can’t be too upset. Thanks, as always for providing homework solutions TMB. 
Figured it is time for me to post some charts as well, hoping to get some feedback from you guys…
Saw the following on the EURUSD 1H, similar formation to the one Tmoneybags saw on the EURJPY.
Unsure whether it is invalid Because of the wick that is higher than my C… Anyway, perfect convergence at XA 0.382 and CD 2.618.
Thanks for any feedback!

That is very similar to what I spotted, I drew my swings a little different but agree on the point of convergence for D. See my post from last page.