A Simple Mean Reversion Strategy

Today I would like to share what I consider, the most fun strategy to trade that I personally use.

It’s simple, it works, and anyone can do it. Not only that, you can use it on any timeframe, depending on how much time you’d like to spend in front of the charts.

Some people really enjoy spending lots of time on the charts, while others only want to check in only a few times a day to adjust their positions. Regardless of where you are on that spectrum, this strategy can work for you.

Although, on the surface, the strategy is very simple and easy to get started with, I will be diving deeper into the inner workings of why it can work from a market structure perspective.

With that being said…

Let’s start with indicators. There is only 1 indicator that is required, and that is the 200 MA (Moving Average). This is what we consider to be “fair value” for any given currency.

We know prices will always return to their “fair value”, so this is where we want to GET OUT of the market. When price is above/below it’s “fair value”, is where we want to GET IN the market.

So the entry and exit rules are simple:

  • If price is above “fair value”, we can sell the asset. We exit our shorts once the market returns to “fair value”.
  • If price is below “fair value”, we can buy the asset. We exit our longs once the market returns to “fair value”.

Beyond these core rules, you can season the strategy how you like for specific entries be it using price action, RSI or other indicators. I will share more on my personal seasoning later…

At this point, most of you reading this are probably thinking, “This guy can’t be serious…” But, I can assure you, I am. Below are my own results from trading this strategy on EUR/GBP last month using the 1H chart:

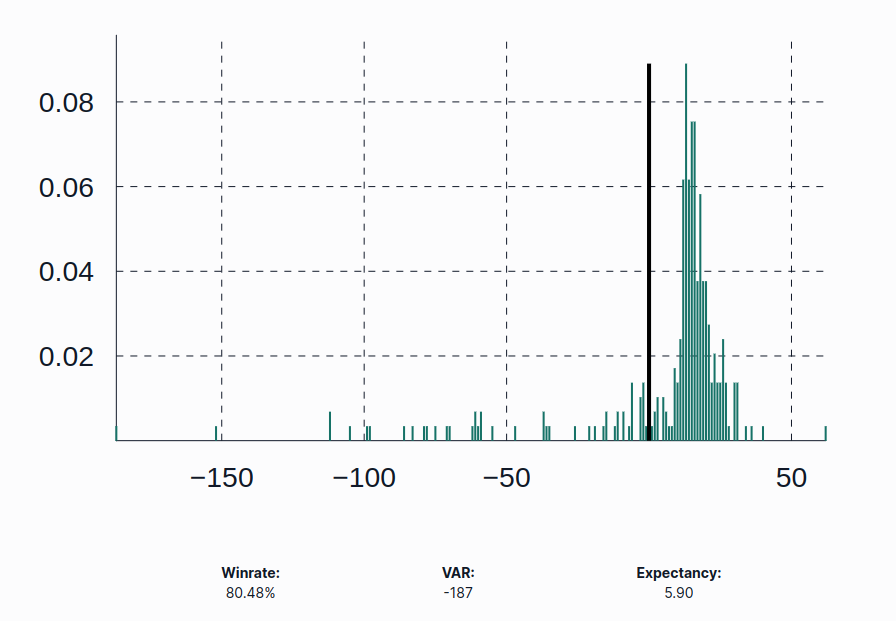
The quick overview is, I have maintained a winrate of about 80%, I made on average 5.9 pips per trade, and my Value At Risk was -187. My median win is about 15 pips, and my median loss was about 20 pips.

And this is how it looks month after month…

There is one caveat to this strategy though… It will only work if you manage your account like it’s a real business that is buying and selling perishable products for profit.

I will dive deep into this later but what it essentially boils down to is this, you need volume to consistently make stable returns. Not volume in size, but volume in deals. This means you must do 2 things:

  • Stay Small
  • Trade Often

A short example to illustrate the point. Imagine a grocer who is selling tomatoes. Based on current market demand, they estimate they can sell $100 worth of tomatoes over the next week, and for every tomato they sell, they expect to make $1.00. But they have $3000 of cash.

Their expected value of each tomato transaction is $1.00, so mathematically, why not buy $3000 worth?

Even though they could try and buy $3000 of tomatoes to sell over the next week, the probability of $2900 worth of tomatoes going bad is so high, that it would be foolish to buy that much.

The expected value of the first $100 worth of tomatoes is very positive. However, the expected value beyond that point goes straight to -100%, the further you go beyond it, the fast you eat up the gains from the first $100 of tomatoes.

They have to stay small in tomatoes and use their money on other products.

This strategy is the same way. There is only so much you can bet on any single position or leg depending on when you get in the market, if you go over that, you are removing the edge of the system by taking on excess risk that will almost surely not pay off, similar to the extra $2900 worth of tomatoes the grocer could buy.

This would be a kin to planning your risk around the size of your mean or median loss.

Now even though the median loss is very small, you can see the Value At Risk is actually quite large. It’s very important to know this because when you are thinking about your risk, this is the number you need to make all of your decisions around.

If you used the median or even mean loss instead, you will take on excess risk that will almost surely not payoff, resulting in you losing money so fast it will make your head spin. Mainly because you will quickly find yourself way over-leveraged when drawdown inevitably hits.

So when you are planning your risk, assume the risk of every position is the VAR, not what your mean or median loss is. This will keep you small, which will allow you to trade often.

This is enough for the introduction. I will be posting my trades here going forward to provide a live example of how to use the strategy. I will also post deep dives into the areas mentioned above as time permits. This will include things like:

  • Hidden Risk
  • Estimating the rate of “inventory” perishing.
  • Handling the portfolio like a business.
  • Theoretical modeling drives the advantage of this strategy.

And more!

5 Likes

Interesting. You should say more about this. But it would be most useful in the context of forex as this is primarily a forex forum and resource site.

For an example, you could use EUR/USD. And for instance over the last 5 years. You seem to suggest selling the pair above 200EMA - but where would you start? And of course buying below this level - again, the same question, where would you start?

And the extent of draw-down would also be relevant of course.How would you deal with this?

2 Likes

As I dive deeper into the strategy, and post about trades I am taking, you will start to see some terms that it’s important you understand.

The most fundamental ones are:

  • Fair Value: This is what is considered the fair or true price of the underlying. It is the value of the 200 MA and it is what we trade around.
  • Spread: This is the distance between the current price and/or your entry and it’s fair value.
  • Premium: This refers to the positive spread of an underlying. When the spread is positive, the market is trading at a premium.
  • Discount: This refers to the negative spread of an underlying. When the spread is negative, the market is trading at a discount.
  • Theta: In option theory, this is the rate at which the option’s price declines over time. In our model, this is the rate at which the fair value is converging towards our entry or the current price. This is the rate at which our position will lose its premium or discount over time. Traditionally, Theta was used as a shorthand for the Greek word meaning death (Thanatos).
1 Like

It will get more specific shortly. Just couldn’t brain dump everything was once and need to lay the ground work so folks can easily digest it.

I want to be clear, this is strictly designed for the Forex market because the market is as liquid as it is. Liquidity equals efficiency, which is what this strategy needs. The returns shown above are from EUR/GBP.

The more efficient the market, the more accurate the “fair value” is.

Regarding the drawdown. That is the VAR mentioned in the first post. It’s essentially an estimate of what you can expect your worse case scenario could be for any single entry or leg.

As for when to entry, I will get very in depth on when, but to put it simply, you want to enter when the spread is large enough that there is a good amount of premium or discount, but too large as this is often where the drawdowns will strike.

This is also way you need to stay small and trade often.

As you enter, you are trying to capture a premium or discount from the underlying’s fair value. This premium or discount is going to decay at the rate referred to as theta (the speed at which the MA is moving toward your entry).

Theta is almost always working against you. As it does though, you will typically have the opportunity to average up. Never average down even if you can. Otherwise you end up like the tomato seller buying $500 of tomatoes when you can only offload a $100 worth.

1 Like

why the MA-200? what’s “fairer” about that than (say) the MA-100 or the MA-50?

they’ll always return (eventually) to any moving average you select in advance as representing your own opinion of their fair value, or of anything else, but by the time they do so, the MA itself will often have moved so much that your position is still losing

this is why so many authors of respected trading textbooks that have stood the test of time refer to such strategies as the “mean reversion fallacy” or “mean reversion trap” and emphasize the importance of avoiding it as a strategy

you say that almost as if you believe it’s based on some kind of objective reality! i’d like to think that you know it isn’t, really :crazy_face:

the problem there is with the word “so”

even if it’s true that they always return to their “fair value”, and even if you’ve chosen your definition of “fair value” well and correctly for every single occasion, why is that a reason for wanting to get out of the market there?

3 Likes

Thanks for the comments @flamingoproxy! You raise a lot of good points/leading questions so I will elaborate/try to answer as best I can!

why the MA-200? what’s “fairer” about that than (say) the MA-100 or the MA-50?

I use the 200 because I like the “speed” at which it trades and the size of the premium/discounts it provides. It’s also a very popular one that is commonly used by both retail and institutional investors alike.

You could use any period you want though, the thing is, the smaller the MA, the smaller your opportunities will be. They will be higher in frequency but you need to weigh that against the cost. Vice versa for larger MAs.

they’ll always return (eventually) to any moving average you select in advance as representing your own opinion of their fair value, or of anything else, but by the time they do so, the MA itself will often have moved so much that your position is still losing

This is true, and exactly the point. Price itself is stationary, meaning, by definition, it’s “fair value” will move, relative to any period you are looking at. This is not a novel concept, but is the backbone of the entire option pricing industry.

What is “fair” today, will not be “fair” tomorrow, and this will always be true. To improve your understanding of this, let’s look at how options are priced using the Black-Scholes model.

All the black-scholes model does is essentially this. It takes the assumed distribution of the underlying, factoring in a risk-free rate. It then takes any given strike price and uses the distribution to calculate the AVERAGE payoff for all possible payoffs according to the distribution. It then discounts this payoff by the risk-free rate.

The average payoff of today is not the same as tomorrow, this means the fair value of an option changes from day to day, decaying with Theta, just like our model. The options price over time is the moving average of all possible payoffs accounted for by the model over the duration of the option.

Different durations result in different prices, from a mathematical standpoint, all are assumed “fair”.

Does the fact that the option’s “fair value” changes day-to-day mean options can not be priced, sold, and managed by market makers?

Our “fair value” is just like that of an option pricing model, it’s a theoretical value with the explicit assumption that all things will remain equal. Depending on the volatility of the market, the true price after the chips fall can be smaller or larger than what the model says is “fair”.

Does this mean the model is broken? Not at all, all it means is, you need to understand the risk associated with the model’s error, and what conditions result in which direction the error occurs in and it’s magnitude, as these are what you are actually betting on when trading the system. In options market making, and all options trading in general, its volatility…

I’ll expand more on what they are for our model, but for now, I think this should answer what you are asking.

you say that almost as if you believe it’s based on some kind of objective reality! i’d like to think that you know it isn’t, really

The paragraphs above should answer this. If you do not find it sufficient though, please let me know what areas you are confused about as it relates to the 2 quoted sections above.

even if it’s true that they always return to their “fair value”, and even if you’ve chosen your definition of “fair value” well and correctly for every single occasion, why is that a reason for wanting to get out of the market there?

I believe this is also answered above. But like the previous quote, please let me know if there are areas you are still confused/would like clarification on.

Thanks again for the great questions! These are what make the discussion truly rich and meaningful!

3 Likes

I take it this is a multiple entry, cost averaging system. Otherwise your entry timing needs to be bang on and your entry criteria is vague.

Apologies if I missed something, there’s a lot in there and kids have been distracting me

Same thread by same name on FF, not sure what he is selling but it’s coming…

2 Likes

@FOK Wanna bet on it? :sunglasses:

1 Like

Yes, you need to cost average. This is why the 2 core rules of the risk management is STAY SMALL and trade often.

You can only do the latter if you are already doing the former.

Additionally, the smaller the spread, the larger your VAR will be. So your initial entries should not be your larger ones.

2 Likes

I have an EA that trades this. It’s basically the kof strategy simplified from @AmericanTrader thread. And I have some bad news. It doesn’t make much money.

Tell me your settings for when to make first entry, when to add and what size. I’ll plug them into the EA this week and run a back test. The win rate was really high, but every now and again, a stubborn trend wipes out almost all of the profits.

It is possible to still make money on these trends with mean reversion, but it requires a lot of time to keep taking profits on the pullbacks and re-entering. Needs very good judgement of price action. I don’t know how to program that

3 Likes

thanks - that’s what i was wondering

this part was already fairly clear :wink:

well - that’s “cost averaging” for you, isn’t it? :frowning:

thank you for sharing, this sounds easy… and well, it is. i trade similar but i don’t use MA instead i use a Bollinger band (which is also an MA if you take it serious) and i only enter markets when the price is above/belowe the middle band because, as you said, price will mostly return at the median/fair value.

i also use the ADX to get a confirmation because this strategy only works in ranging markets (guess what, we are talking about mean reversion). i only trade when the market is NOT trending and have similar winning rate i think it was about 71 - 76% winning trades.

I’m wondering myself if MA/fair value would also work when market is trending🤔 would love to read further details.

happy trading my friend😊

2 Likes

you could use Bollinger band for starting point and sell when price is near uppper band, it will mostly return to the middle band.

1 Like

@this_is_ando It’s a good question to ask, “will it work in trending”, but when it comes to currency markets, there really aren’t trends.

This is the distribution of essentially every currency pair:

It’s very close to normal except one consistent divergence, kurtosis. But besides this, the skew is almost always 0, the same as the total expectancy of the distribution as a whole.

In a normal distribution, Kurtosis remains at 3, in currency prices, it’s consistently over 3, even when you extend the duration.

It’s consistently higher, meaning there are large moves that occasionally occur in both directions. The total skew of these moves is still 0 though.

This data poses a good question for currency traders to think about:
What’s the difference between what most would call a “trend” and a “tail move”?

The answer is in the skew… Most typically confuse the two.

So we will have moves that look trendy, but they are essentially tail moves. This is why one of the most fundamental rules is to stay small so you can trade often and not be blown out by tail moves, because I can guarantee you they will come.

4 Likes

I was going to ask if somebody was maybe using BBs for entry signals.

1 Like

What is your graph showing? An unlabelled chart is hard to understand what it’s telling me.

Not sure what you mean by there’s no such thing as a trend. The USD has been rising vs most of the major currencies for over 10 years.

I’m not saying this can’t work, but your criteria for entry are non existent, and going with the trend, short or longer term is almost certainly going to be more profitable. Especially with cost averaging

It’s a distribution of daily price returns (in pips) for EUR/USD.

It will help to understand what I am saying if you learn more about probability distributions, specifically, the law of long leads, or arcsine law.

Even though a distribution is perfectly fair or normal (flipping a coin to create price paths), the least likely return value it is to have is 0. 1/2 of its values will spend most of its time on one side of the starting point or the other.

All of these moves look like “trends” going up or down. They are not though, they are long leads.

So the question is, what’s the difference between a trend and a long lead from a sample set?

1 Like

What time period is that over? I don’t need to study statistics to see that over 15 years EURUSD has posted lower highs and lower lows continually. If you’re telling me that 15 years isn’t a trend, then we’ll have to agree to disagree. And no matter what you call it, you shouldn’t try to catch a falling knife

1 Like

lol when did I say to catch falling knifes?

Also this is a “strong trend” for EU since 03?

You seem to have a comprehension problem. You should re-read what I wrote.

Your lack of understanding regarding probabilities and statistics will be dangerous to you. It’s akin to using 10 years of data to estimate the size of a 1 and 1000-year flood…

“The flood levels for the last 10 years never exceeded x feet. The trend is obvious that floods don’t go higher than x feet so we can build the levy there…”

If you slice from the peak, it looks “trendy” but that is a single sample path. The law of long leads proves that even in a perfectly normal distribution with no skew, 1/2 of the sample paths are above the starting point (like an uptrend) and 1/2 are below. When you combine them though the skew is 0. There were no trends. Only long leads.

1 Like