In this review, we suggest considering the personal composite instrument (PCI) &GAS/OIL. It reflects the price change dynamics of US natural gas against the American West Texas Intermediate (WTI) light crude oil. Will GAS/OIL prices rise?
Their increase means that natural gas is in greater demand than oil. Since the beginning of 2019, the WTI prices have risen by 28%. Now it is correcting down. Market participants fear the reduction in demand amid a slowdown in the global economy. The ISM manufacturing index fell in February of the current year to the low since November 2016. In China, Caixin/Markit Manufacturing PMI increased slightly in February, but could not exceed the level of 50, meaning an industrial growth. OPEC oil production in February 2019 decreased by 300 barrels per day and reached the low since February 2015 - 30.68 million barrels per day. However, this has not yet prevented oil prices from correcting down. The US increased oil production last week to a record level of 12.1 million barrels per day. In turn, natural gas is in great demand. Its reserves in the US have decreased to the minimum since 2014 and amount to 1.41 trillion cubic feet. This is almost a quarter below the 5-year average level. Exports of liquefied natural gas from the US increased by 68% compared to the level of the last year.
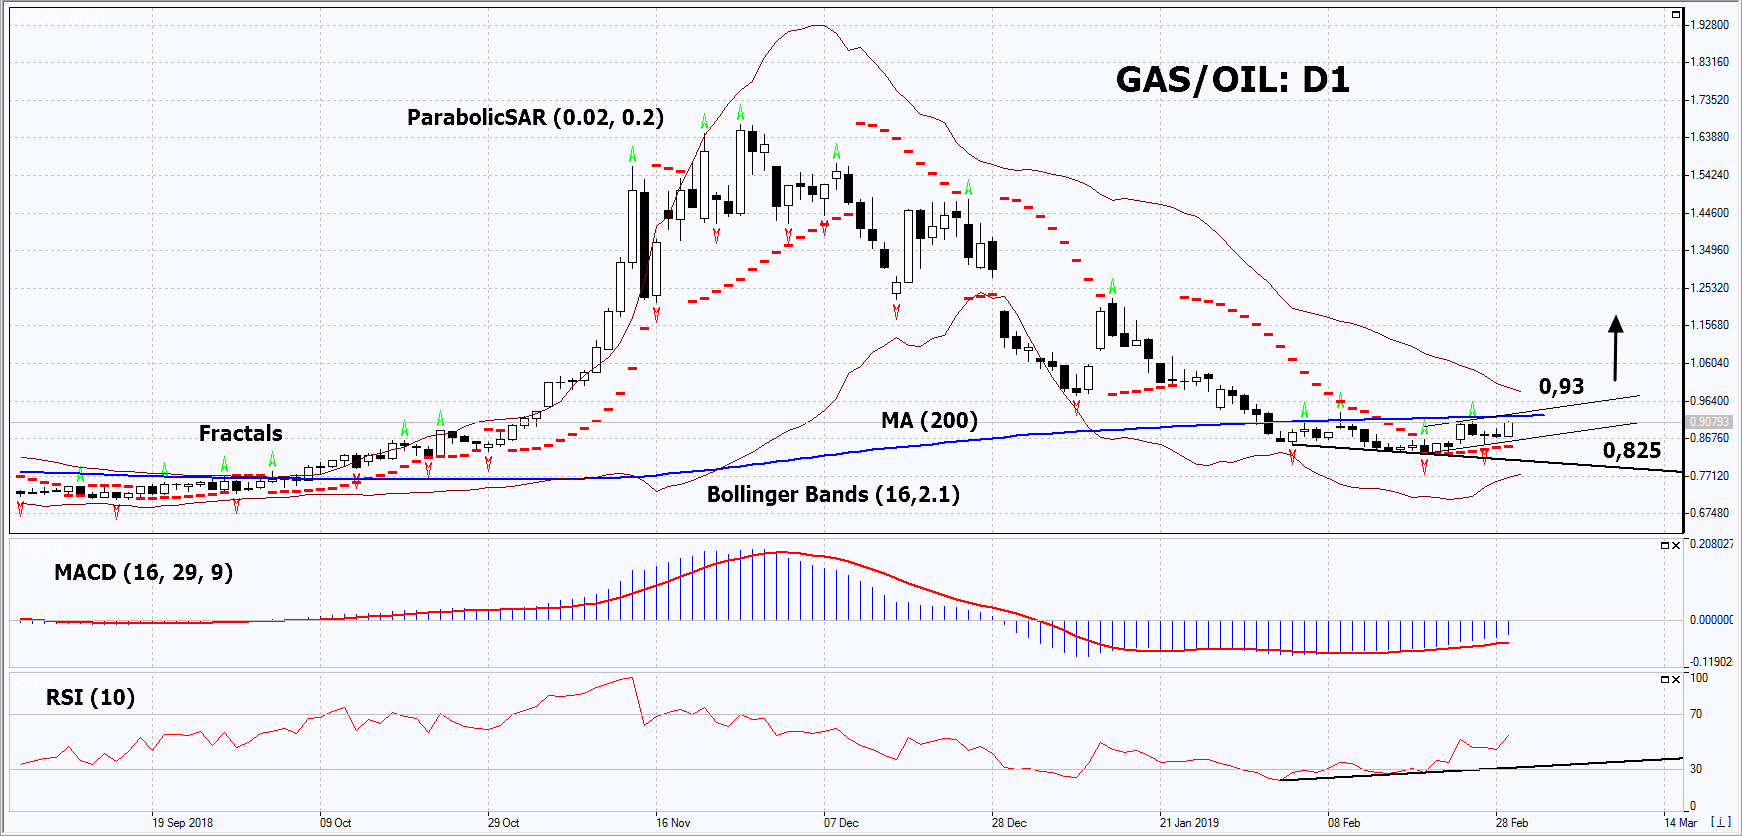
On the daily timeframe, GAS/OIL: D1 has moved from the downtrend to the neutral one. Most technical analysis indicators formed buy signals. The further price increase is possible in case of a reduction in global demand for oil, and an increase in LNG exports from the US.
The Parabolic Indicator gives a bullish signal.
The Bollinger bands have narrowed, which indicates low volatility. The lower Bollinger band is titled upward.
The RSI indicator is above 50. It has formed a positive divergence.
The MACD indicator gives a bullish signal.
The bullish momentum may develop in case GAS/OIL exceeds the 200-day moving average line and its last fractal high at 0.93. This level may serve as an entry point. The initial stop loss may be placed below the two last fractal lows, the low since October 2018 and the Parabolic signal at 0.825. After opening the pending order, we shall move the stop to the next fractal low following the Bollinger and Parabolic signals. Thus, we are changing the potential profit/loss to the breakeven point. More risk-averse traders may switch to the 4-hour chart after the trade and place there a stop loss moving it in the direction of the trade. If the price meets the stop level (0.825) without reaching the order (0.93), we recommend to close the position: the market sustains internal changes that were not taken into account.
Summary of technical analysis
Position Buy
Buy stop Above 0.93
Stop loss Below 0.825