$AAPL Apple Expanded Flat from the 1/18/18 highs?

Longer term on monthly and weekly charts it obviously appears that Apple remains in an uptrend. I will try to explain where the instrument can reach in the expanded flat from the 1/18/18 highs. I will also provide an alternate scenario that will offer a similar buy zone before the next leg higher. Apple’s stock made new highs in January however we think that was part of a larger correction.

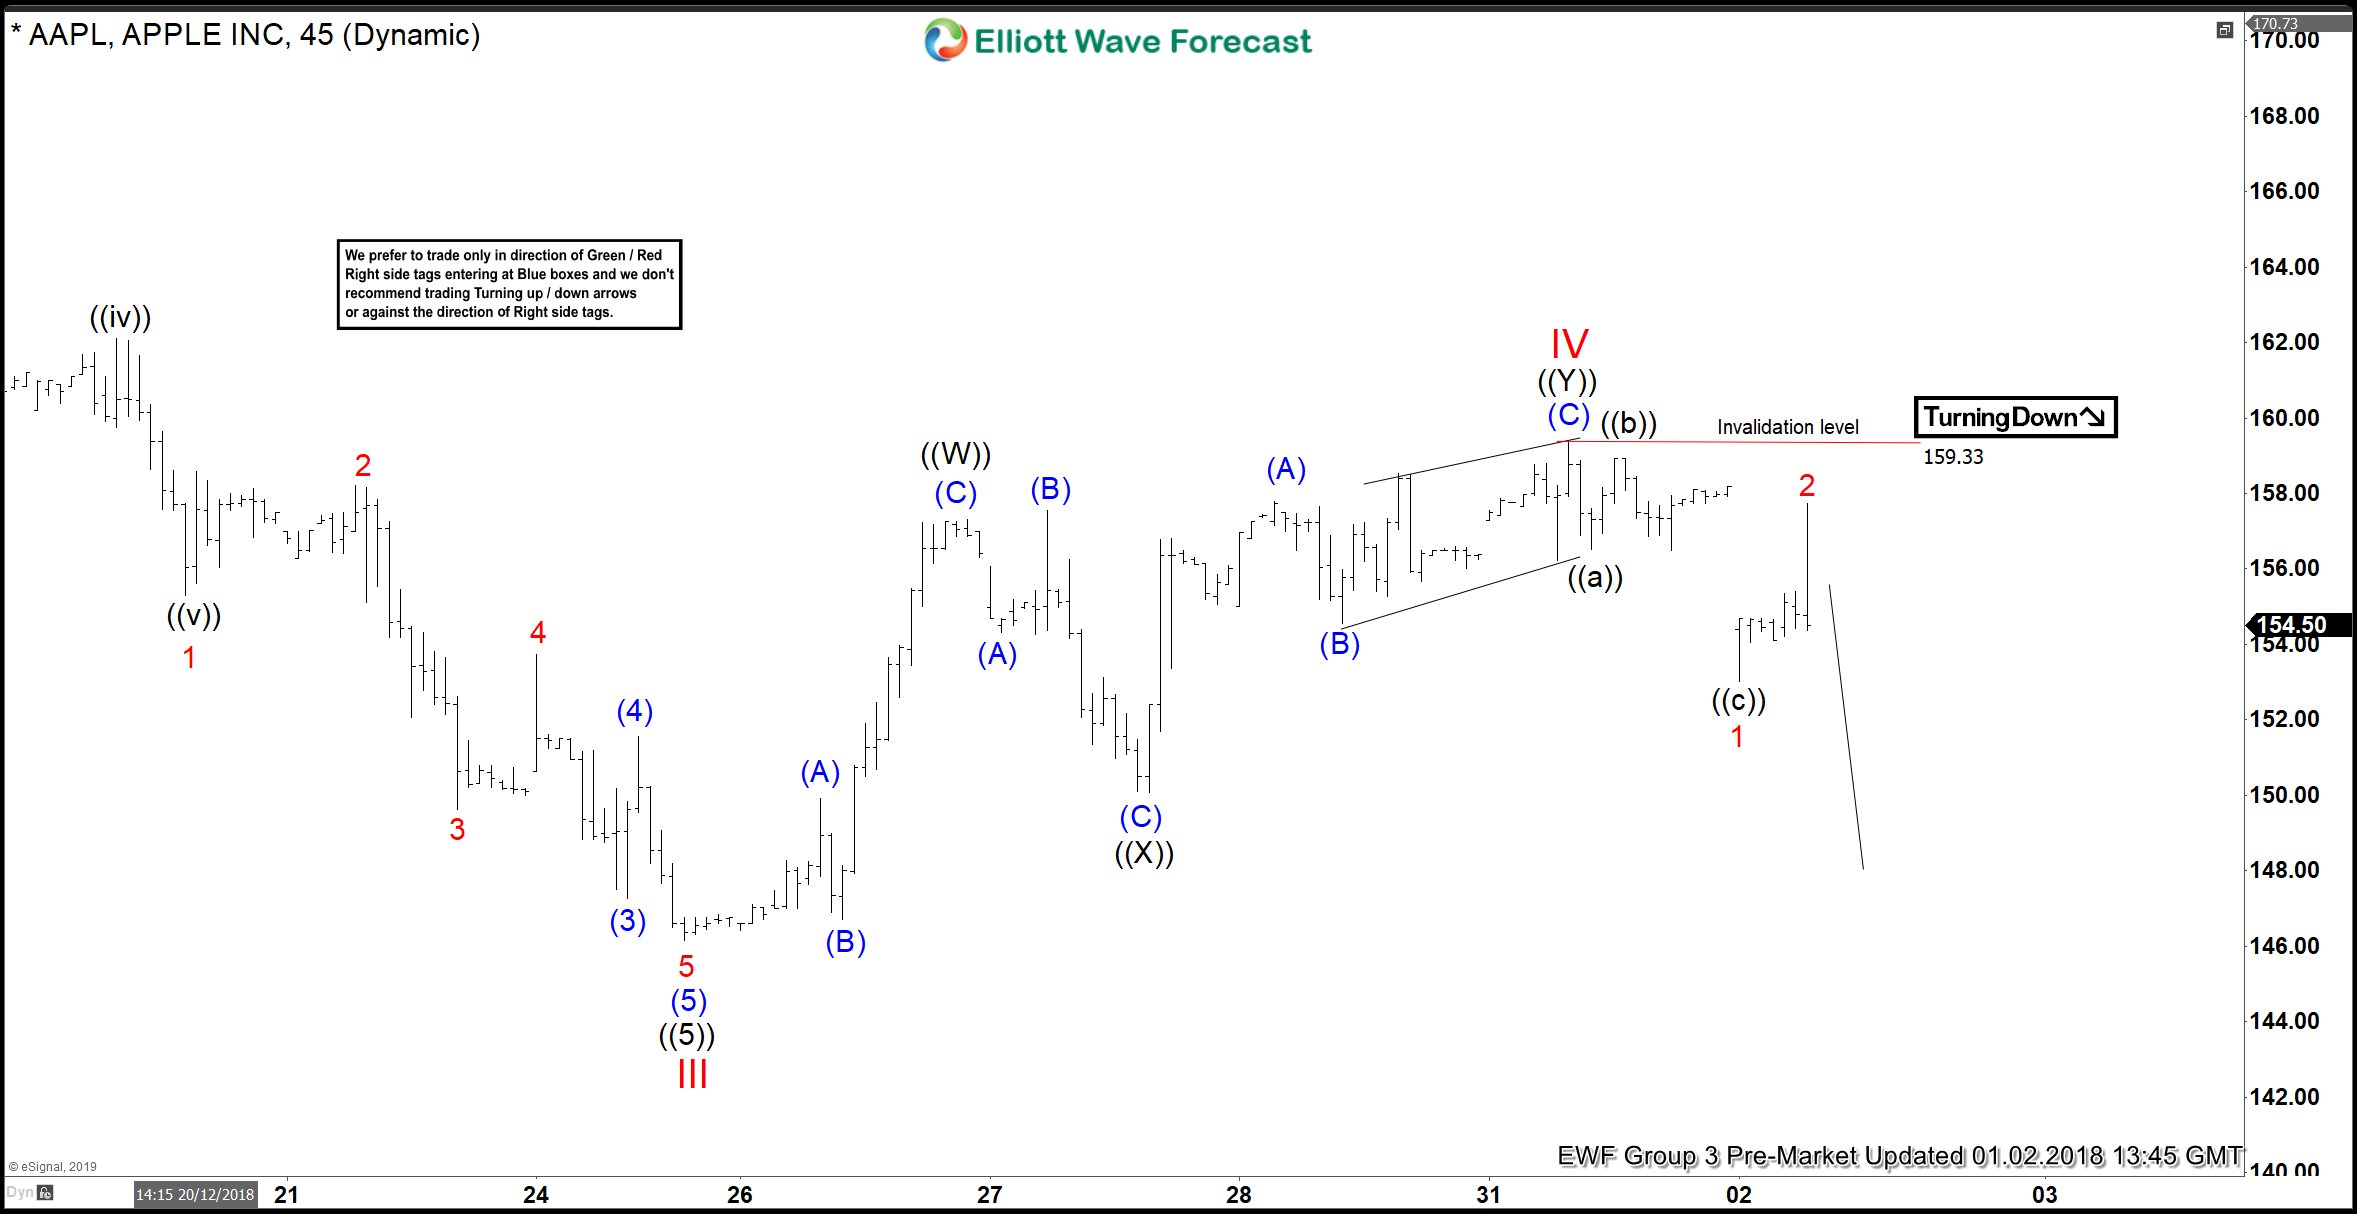
With the possible expanded flat from the January 18 highs, the Elliott Wave structure would be 3-3-5. That means the leg lower from the 1/18/2018 highs to the 2/9/2018 lows was three swings and not an impulsive five waves. From the 2/9/2018 lows, the same can be said for the three swing bounce into the new highs on March 13th 2018. From those highs, this leaves the incomplete structure still needing the wave three of the impulse to complete along with a relatively shallow bounce in wave four followed with a final wave five low that would show momentum divergence compared to the wave three. The conclusion is below the chart.

$AAPL Apple Daily chart

In conclusion.

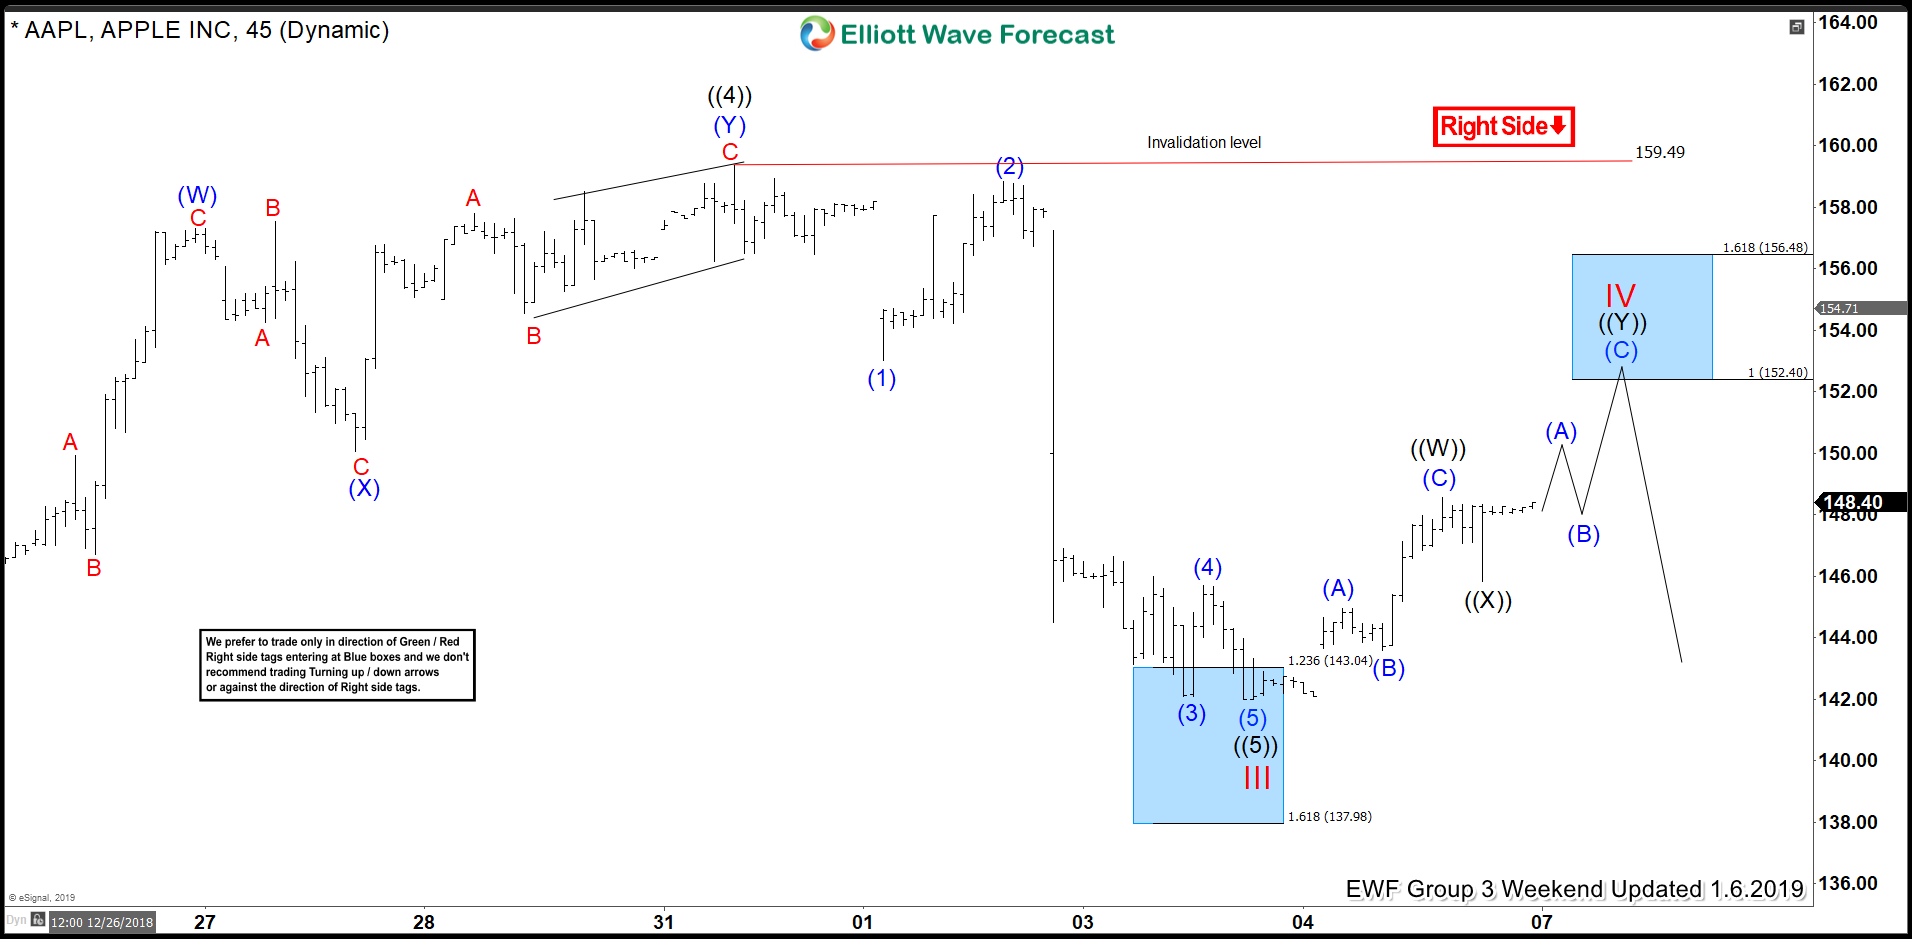
The target area for the the expanded flat is shown in the blue box on the chart and is derived from a Fibonacci extension measurement using a chart platform Fibonacci extension tool. With the beginning point being at the 1/18/2018 highs, go down to the 2/2/2018 lows as point #2. From there up to the 3/13/2018 highs being point #3. That will give the extension area shown on the chart as the potential buy zone.

Finally as I mentioned in the first paragraph an alternative structure and target area will be a simple three swings lower from the 3/13/2018 highs. That would be a double three correction which counts as 3-3-3. This target area is not shown on the chart but I will tell you how to get it. Using the charting platform Fibonacci extension tool in the same manner as before. Begin at the 3/13/2018 highs as point #1 on down to the April 2nd lows as point #2. From there point #3 will be at the April 17th highs. That gives an extension area for a double three correction at the 159.66-147.74 area.

Welcome traders, today we will look at a couple of Apple (APPL) charts. After plunging almost 10% on January 3rd, has the tech giant reached a bottom? And do we really have to depend on news to be on the right side of the market?. The following analysis will show you how profitable and efficient it can be to trade with our philosophy and basic Elliott Wave analysis.

First of all, we start with Apple’s 45 minute chart from the 2nd of January 2018 presented to our members. At the time, we maintained a bearish perspective due to our Elliott Wave analysis. Our count suggested an impulsive 5 wave move cycle starting from October the 3rd. Consequently, with a proposed wave IV top, a final wave V was to start developing at any time.

With our aggressive approach, our members are encouraged to act accordingly with the right side of the market. With this being said, our members had no reason whatsoever to enter a long position in the near term for Apple. The stock missed equal leg target area off ((W)) - ((X)) from 12.25.2018 low by $2 and ended wave IV correction at $159.49

APPL 01.03.2018 45 Min Chart Elliott Wave Analysis

Below you can see an updated chart of APPL from January 6 presented to our members. Although our Elliott Wave count changed, our stance proved extremely valuable. Now we believe the decline from last week is part of a more complex nest within wave III. Nevertheless, it is still within the cycle from October 3rd favoring the continuation of further downside.

Patience and continuous adaptation to the market moves, now presents us with an opportunity to profit. We now have a blue box target area of 152.4-156.48 which represents an equal leg target area off of ((W)) & ((X)). Sellers should appear in this area and push the stock lower or pullback in 3 waves at least. A mapped entry, an invalidation level set up, the right side, add up to great trading opportunities. Above all, waiting for the right signals, puts the odds on our favor.

APPL 01.06.2018 45 Min Chart Elliott Wave Analysis

*Note : Keep in mind the market is dynamic and the presented view might have changed after the post was published.

Trading success is a journey and you will never be perfect at it, but you can always master your reaction to the market.