We will look at the past performance of the 1-hour Elliott Wave Charts of AAPL. In which, the rally from 04 December 2023 low is unfolding as an ending diagonal structure. Showing a higher high sequence favored more upside extension to take place. We will explain the structure & forecast below:
AAPL 1-Hour Elliott Wave Chart From 12.17.2023 Weekend Update
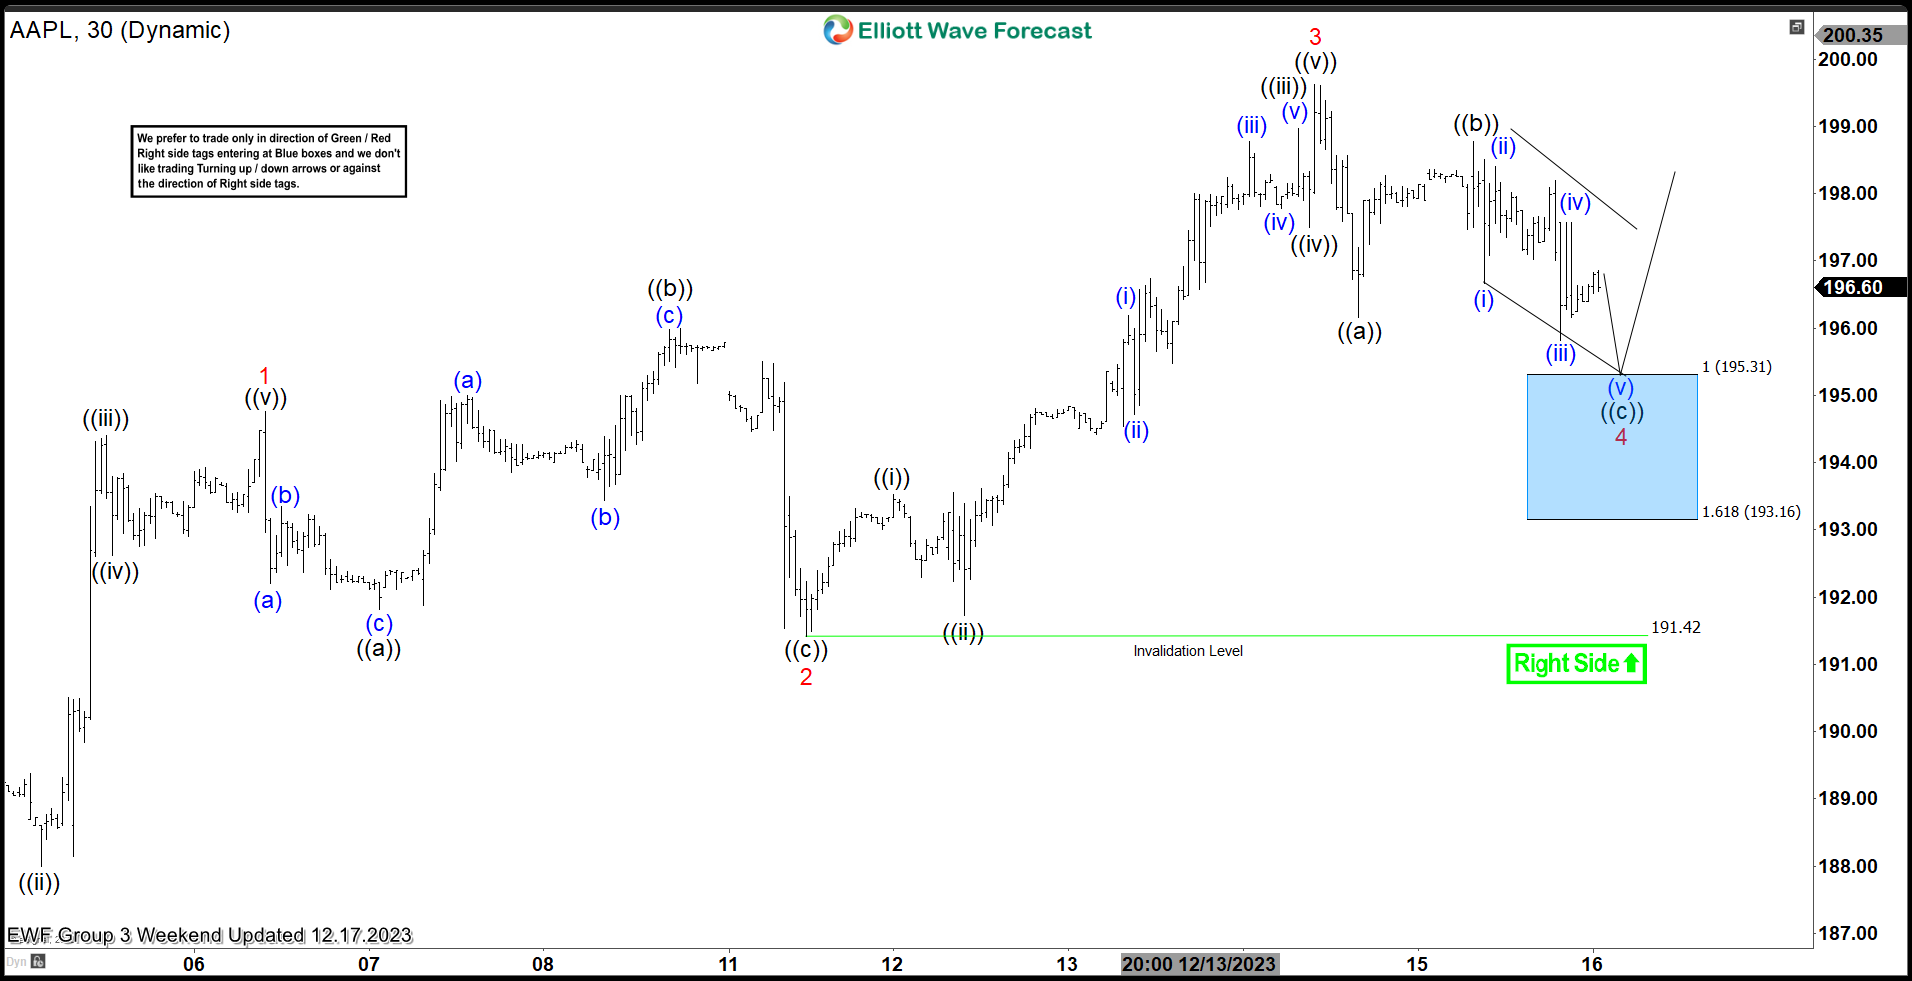
Here’s the 1-hour Elliott wave chart from the 12/17/2023 weekend update. In which, the short-term cycle from the 11/12/2023 low ended in wave 3 of a diagonal at $199.62 high. Down from there, the stock made a pullback in wave 4 to correct that cycle. The internals of that pullback unfolded as Elliott wave zigzag structure where wave ((a)) ended at $196.16 low. Wave ((b)) bounce ended at $198.77 high and wave ((c)) managed to reach the blue box area at $195.31- $193.16. From there, buyers were expected to appear looking for the next leg higher or for a 3 wave bounce minimum.
AAPL Latest 1-Hour Elliott Wave Chart From 12.19.2023 Post-Market Update
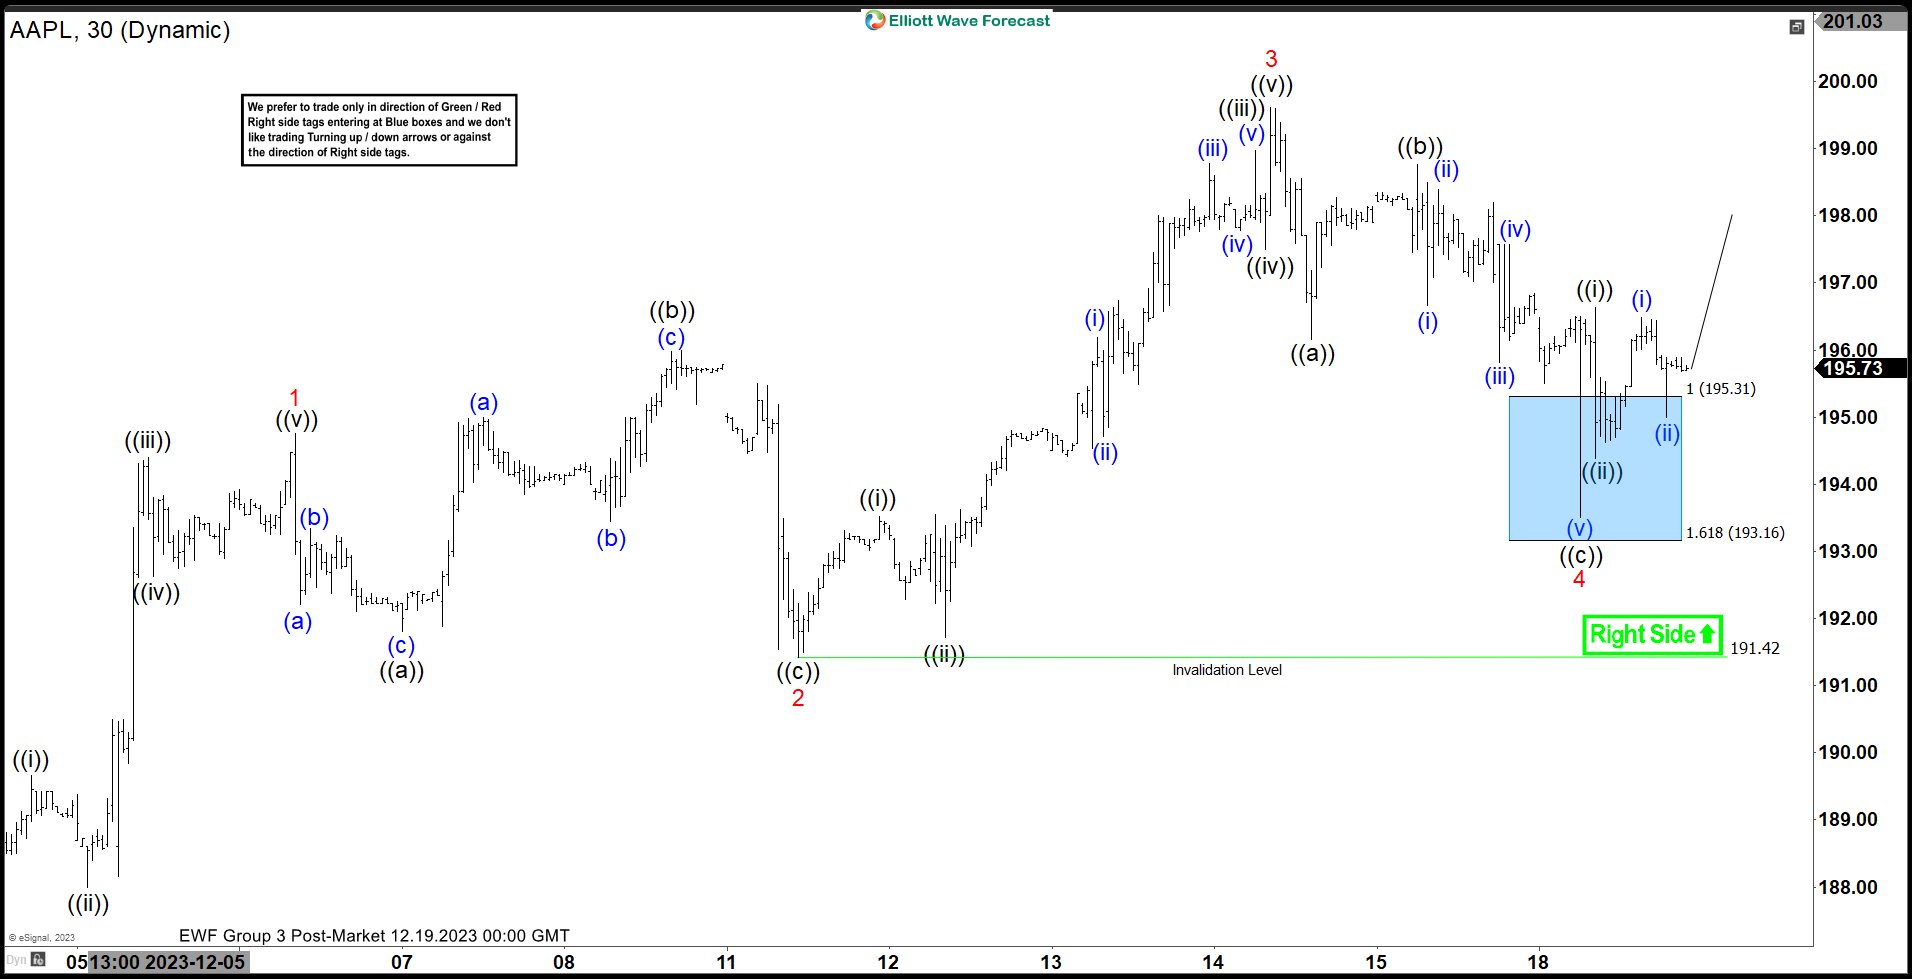
This is the latest 1-hour Elliott wave Chart from the 12/19/2023 Post-Market update. In which the stock is showing a reaction higher taking place, right after ending the zigzag correction within the blue box area. However, a break above $199.62 high is still needed to confirm the next extension higher & avoid a double correction lower.