DAILY TECHNICAL OUTLOOK ON EUR/USD
Last Update At 02 Apr 2014 01:33GMT
Trend Daily Chart
Sideways
Daily Indicators
Turning down
21 HR EMA
1.3790
55 HR EMA
1.3781
Trend Hourly Chart
Sideways
Hourly Indicators
Bearish divergences
13 HR RSI
53
14 HR DMI
+ve
Daily Analysis
One more rise b4 retreat
Resistance
1.3877 - Mar 24 high
1.3845 - Last Tue’s NY high
1.3815 - Y’day’s high
Support
1.3763 - Mon’s NY low
1.3721 - Mon’s low
1.3705 - Last Fri’s 4-week low
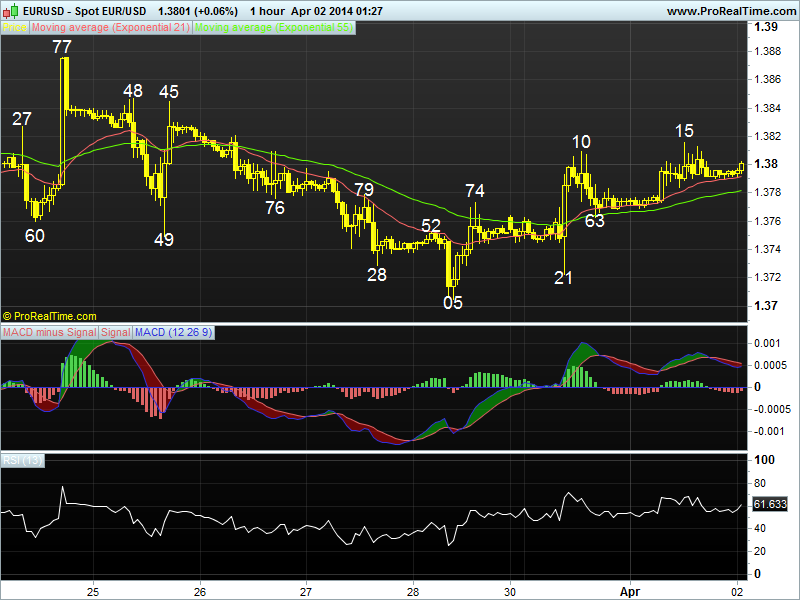
. EUR/USD - 1.3797… Although euro moved narrowly in Asia on Tue after
retreating fm Mon’s high of 1.3810 to 1.3763, renewed buying emerged shortly
after European open n release of better-than-expected German unemployment data
lifted price higher. Euro later briefly rose to 1.3815 in NY morning b4 easing.
. Looking at the hourly chart, y’day’s breach of Mon’s high of 1.3810 to
1.3815 signals decline fm Mar’s 2-1/4 year peak at 1.3967 has indeed formed a
temporary low at last Fri’s near 4-week trough at 1.3705 n further gain twd
1.3936/45, being ‘natural’ 50% r of 1.3967-1.3705 n last Tue’s NY high respect-
ively , may be seen after consolidation, however, as ‘bearish diverging signals’
have appeared on hourly oscillators, sharp gain is unlikely n reckon price wud
falter below pivotal res at 1.3877 (Mar 24 high) n yield strg retreat later
today or tom. Looking ahead, a daily close below 1.3763 sup wud indicate afore-
said correction is over n bring weakness to 1.3721 n then re-test of 1.3705.
. In view of abv analysis, selling euro on intra-day upmove is still recom-
mended n only a firm breach of 1.3877 res wud abort this bearish scenario n
shift risk to upside for subsequent gain twd 1.3948 (Mar 17 high).
DAILY TECHNICAL OUTLOOK ON EUR/USD
Last Update At 09 May 2014 00:04GMT
Trend Daily Chart
Sideways
Daily Indicators
Bearish divergences
21 HR EMA
1.3872
55 HR EMA
1.3893
Trend Hourly Chart
Near term down
Hourly Indicators
Rising fm o/s
13 HR RSI
26
14 HR DMI
-ve
Daily Analysis
Consolidation with downside bias
Resistance
1.3952 - Tue’s high
1.3905 - Y’day’s Asian low (now res)
1.3890 - Mon’s high (NZ)
Support
1.3812 - Last Fri’s low
1.3771 - Last Wed’s low
1.3736 - 50% r of 1.3477-1.3995
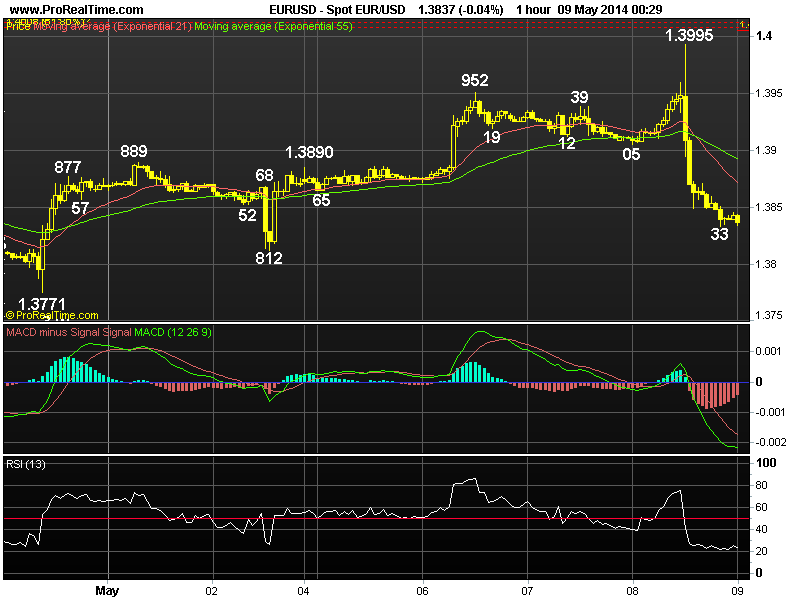
. EUR/USD - 1.3840… Although euro briefly penetrated Mar’s 1.3967 high to a fresh 2-year peak of 1.3995 (EBS) Thu after ECB kept rates unchanged, as usual , ECB President Draghi’s comments that a rate cut is possible in Jun plus his concern on euro’s strength at the press conference sent euro tanking to 1.3833.
. Looking at the daily picture, despite euro aforesaid rise to 1.3995, sub-
sequent near term reversal fm there confirms MT uptrend has indeed formed a temporary top there as this lvl was accompanied by prominent ‘bearish divergences’ on the hourly & daily oscillators. Current price action suggests euro is at least correcting the intermediate rise fm 1.3672 (Apr low) or the up move fm 1.3477 (Feb), a ‘minimum’ 38.2% r of the latter move wud pressure the single currency to 1.3797 n then 1.3736 (50% r) later next week. Therefore, selling euro on recovery in anticipation of such move is recommended n only abv a daily close abv 1.3952 wud dampen present bearish scenario on euro.
. Today, euro has remained under pressure at Asian open, however, as hourly indicators’ readings are in o/sold territory, further steep fall is unlikely to be seen in Asia n reckon 1.6812 n bring recovery b4 another decline.
[B]DAILY TECHNICAL OUTLOOK ON EUR/USD[/B]
Last Update At [B]14 May 2014[/B] [I]23:58GMT[/I]
[B]Trend Daily Chart [/B]
Sideways
[B]Daily Indicators [/B]
Bearish divergences
[B]21 HR EMA [/B]
1.3714
[B]55 HR EMA[/B]
1.3729
[B]Trend Hourly Chart [/B]
Down
[B]Hourly Indicators[/B]
Bullish convergences
[B]13 HR RSI [/B]
53
[B]14 HR DMI[/B]
-ve
[B]Daily Analysis[/B]
Consolidation with upside bias
[B]Resistance [/B]
1.3812 - May 02 low (now res)
1.3775 - Mon’s high
1.3745 - Last Fri’s low (now res)
[B]Support[/B]
1.3689 - Tue’s 1-month low
1.3672 - Apr 04 low
1.3643 - Feb 27 low
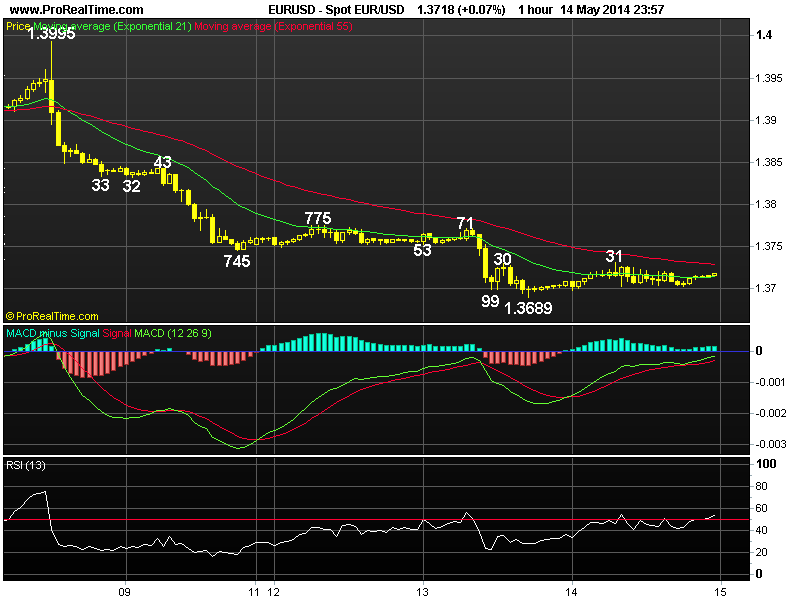
. [B] EUR/USD [/B]- 1.3718… The single currency finally gained respite y’day after tumbling fm last Thur’s 2-1/2 year peak of 1.3995 to a 1-month trough of 1.3689 on Tue, minor short-covering lifted the pair to 1.3731 in Europe, price traded well abv 1.3689 in quiet NY session as focus was on yen & the sterling.
. Looking at the daily picture, euro’s aforesaid selloff fm 1.3995 signals MT uptrend has formed a top there as this lvl was accompanied by prominent ‘bearish divergences’ on the hourly & daily oscillators, subsequent breach of 1.3771 sup suggests price is en route to re-test daily chart obj. at 1.3672 (Apr low), below this pivotal sup wud ‘violate’ the recent series of higher lows n higher highs, confirming MT uptrend fm 2012 trough at 1.2042 (Jul) has formed a top there, then further weakness to 1.3518 wud be seen later this month, this is a ‘minimum’ 38.2% r of the intermediate rise fm 1.2745 (2013 low). Failure to penetrate 1.3672 sup n subsequent rebound abv 1.3905 wud suggest pullback fm 1.3995 has ended n risk wud shift to the upside for gain twd 1.3995.
. Today, we’re holding a long position for a corrective bounce twd 1.3771 but 1.3812 (prev. low, now res) shud cap upside. Below 1.3672 extends to 1.3643.
WEEKLY TECHNICAL OUTLOOK ON EUR/USD
Last Update At 25 May 2014 23:26GMT
Trend Daily Chart
Sideways
Daily Indicators
Falling
21 HR EMA
1.3634
55 HR EMA
1.3650
Trend Hourly Chart
Down
Hourly Indicators
Rising fm o/s
13 HR RSI
41
14 HR DMI
-ve
Daily Analysis
Consolidation b4 decline resumes
Resistance
1.3734 - Last Tue’s high
1.3688 - Last Wed’s NY res n Y’day’s high
1.3653 - Last Fri’s Asian high
Support
1.3615 - Intra-day fresh 3-month low in NZ
1.3563 - Feb 27 low
1.3518 - 38.2% r 1.2745-1.3995
. EUR/USD - 1.3628…. Although euro gained respite initially last week b4 falling again on renewed cross-selling in euro, price penetrated previous 1.3648 low to 1.3635 Wed. Despite a brief recovery, euro tanked on downbeat German & EZ mfg & services PMIs, price weakened to a fresh 3-year trough of 1.3616 on Fri.
. Looking at the daily picture, last week’s breach of 1.3648 to 1.3616 confirms decline fm May’s 2-1/2 year peak at 1.3995 has once again resumed n this move signals uptrend fm 2012 bottom (Jul) has made a top there, the single currency is en route to 1.3518, this is a ‘minimum’ 38.% r of the intermediate rise fm 1.2745 to 1.3995, then next daily chart obj. at 1.3477 (2014 low in Feb), having said that, as daily indicators wud be in oversold territory on such move, reckon 1.3370 (50% r fm 1.2745) wud contain weakness. So selling on recovery in anticipation of decline to aforesaid downside targets is recommended n only a daily close abv 1.3734 wud dampen present bearish scenario on euro.
. Today, euro briefly weakened to 1.3615 in NZ after preliminary European Parliament elections were announced n with price currently trading below 21-hr n 55-emas, selling on recovery is recommended n only abv 1.3653/59 risks 1.3688.
[B]DAILY TECHNICAL OUTLOOK ON EUR/USD[/B]
Last Update At [B]03 Jun 2014[/B] [I]00:14GMT[/I]
[B]Trend Daily Chart [/B]
Down
[B]Daily Indicators [/B]
Falling
[B]21 HR EMA [/B]
1.3605
[B]55 HR EMA[/B]
1.3612
[B]Trend Hourly Chart[/B]
Sideways
[B]Hourly Indicators[/B]
Falling
[B]13 HR RSI[/B]
38
[B]14 HR DMI[/B]
-ve
[B]Daily Analysis[/B]
Consolidation b4 decline resumes
[B]Resistance [/B]
1.3688 - May 22 high
1.3669 - Last Tue’s high
1.3650 - Last Fri’s high
[B]Support[/B]
1.3586 - Last Thur’s 3-1/2 month low
1.3563 - Feb 27 low
1.3518 - 38.2% r 1.2745-1.3995
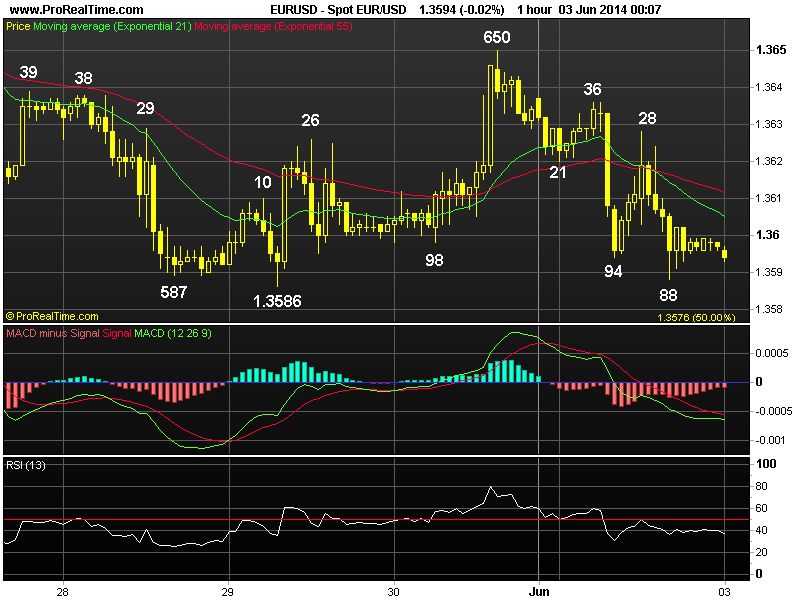
. [B]EUR/USD - 1.3594[/B]… Euro remained under pressure on Mon due to growing speculation ECB will loosen policy at its meeting Thur, price retreated fm 1.3643 (AUS) to 1.3594 in European morning n then further to 1.3588 in NY afternoon after Germany showed that the annual inflation slowed in May b4 recovering.
. Looking at the hourly n daily charts, y’day’s decline fm 1.3643 to 1.3588 confirms the recovery fm last Thur’s 3-1/2 month bottom at 1.3586 has ended earlier at 1.3650 last Fri n re-test of said sup is seen, break wud indicate MT uptrend fm 1.2042 (2012 low) has formed a top at May’s 2-1/2 year peak at 1.3995 n as daily indicators are falling, price is en route to 1.3249 later this month, this is the ‘minimum’ 38.2% r of aforesaid entire rise fm 1.2042. However, euro shud hold well abv 1.3105 (Sep 13’) n yield strg rebound later.
. Today, as long as 1.3650 holds, selling euro on recovery for resumption of decline to 1.3540/50 is favoured, however, as hourly oscillators’ readings wud display ‘bullish convergences’ on next decline, reckon 1.3518 (38.2% r of intermediate rise of 1.2745-1.3995) shud remain intact. Only abv 1.3650wud indicate a temporary low is in place n risk retracement to 1.3384/88 b4 down.
WEEKLY TECHNICAL OUTLOOK ON EUR/USD
Last Update At 08 Jun 2014 23:54GMT
Trend Daily Chart
Down
Daily Indicators
Turning up
21 HR EMA
1.3643
55 HR EMA
1.3634
Trend Hourly Chart
Near term up
Hourly Indicators
Neutral
13 HR RSI
54
14 HR DMI
+ve
Daily Analysis
Consolidation with downside bias
Resistance
1.3734 - May 19 high
1.3691 - 38.2% r of 1.3995-1.3503
1.3677 - Last Fri’s 2-week high
Support
1.3622 - Last Fri’s low
1.3586 - May 29 low
1.3569 - 61.8% r of 1.3503-1.3677
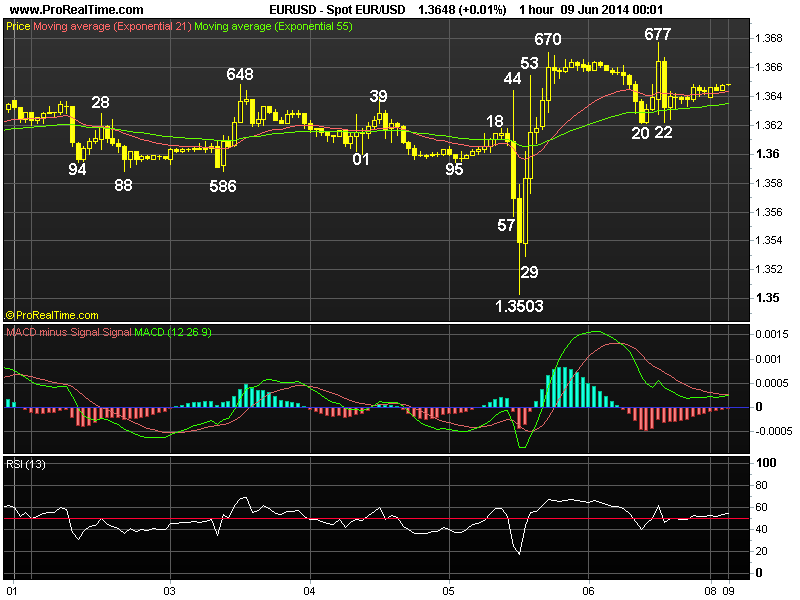
. EUR/USD - 1.3647… The single currency remained under pressure initially last week due to mounting speculation of ‘bold’ stimulus measures fm the ECB. Although euro briefly tumbled to a near 4-month trough of 1.3503 after anticipated ECB’s action, short-covering lifted price to 1.3670, then 1.3677 on Fri.
. Let’s look at the daily picture 1st, although euro’s aforesaid rally fm last Thur’s 1.3503 low confirms the decline fm May’s 2-1/2 year peak at 1.3995 has finally formed a temporary low there n several days of choppy consolidation is expected this week, as long as 1.3586 (previous low n also good sup) holds, mild upside bias remains for price to stage a corrective rise to 1.3691, this is the ‘minimum’ 38.2% r of the entire fall fm 1.3995-1.3503, however, as hourly oscillators’ readings wud display ‘bearish divergences’ on such a move, strg gain beyond there is not envisaged n reckon euro wud hold below below previous daily res at 1.3734 (May 19 high) n bring another decline later this week.
. Today, Fri’s retreat fm 1.3677 signals 1st leg of correction fm 1.3503 has ended n as many European centres are closed for Whit Monday holiday, consolidation is in store, so trading euro on both sides of the market is favoured.
DAILY EUR/USD TECHNICAL OUTLOOK
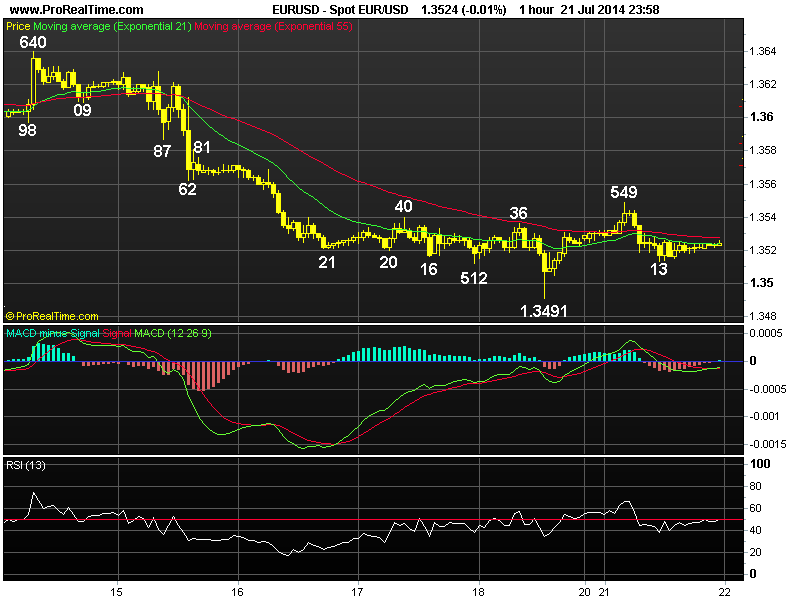
Last Update At 22 Jul 2014 00:03GMT
Trend Daily Chart
Down
Daily Indicators
Bullish convergences
21 HR EMA
1.3524
55 HR EMA
1.3527
Trend Hourly Chart
Down
Hourly Indicators
Bullish convergences
13 HR RSI
48
14 HR DMI
-ve
Daily Analysis
Consolidation b4 marginal fall
Resistance
1.3650 - Last Thur’s high
1.3589 - Last Thur’s low
1.3549 - Y’day’s high
Support
1.3492 - Last Fri’s 5-month low
1.3477 - 2014 low (Feb 03)
1.3454 - 50% proj. of 1.3995 to 1.3503 fm 1.3700
. EUR/USD - 1.3523… Euro extended recovery fm last Fri’s fresh 5-month trough of 1.3491 to 1.3549 on Mon after triggering stops abv 1.3540 in Asia, how ever, offers at 1.3550/60 capped intra-day gain n selling emerged at European open due to weakness in European shares n price dropped to 1.3513 in NY morning.
. Looking at the daily chart, despite euro’s rebound fm 1.3491 to 1.3549, last week’s breach of Jun’s low at 1.3503 confirms the MT downtrend fm May’s 2-1/2 year peak at 1.3995 has once again resumed n weakness to next daily chart obj. at 1.3477 (2014 low) wud be forthcoming soon this week n later twds 1.3454 (this is 50% proj. of 1.3995-1.3503 measured fm 1.3700), however, as the hourly indicators have already displayed ‘bullish convergences’, reckon 1.3396/99 (61.8% projection of 1.3991.3995-1.3503 n daily sup respectively) wud hold on 1st testing. On the upside, only a daily close abv 1.3589 (prev. sup, now res) wud be the 1st signal temporary low is in place, then stronger correction to 1.3640/50 wud be seen but res at 1.3700 shud remain intact.
. Today, we’re holding a short position in anticipation of marginal fall with stop now abv 1.3549 res, break may risk retracement twd 1.3589.
DAILY EUR/USD TECHNICAL OUTLOOK
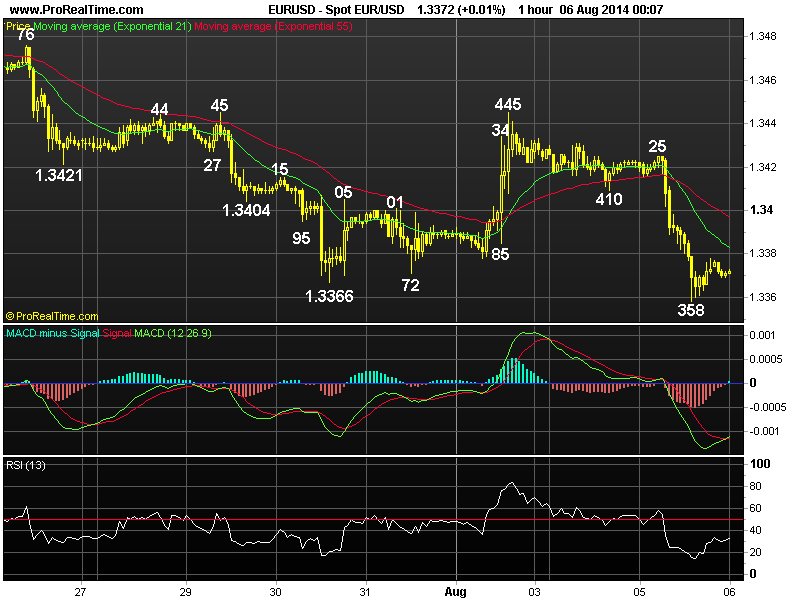
Last Update At 06 Aug 2014 00:12GMT
Trend Daily Chart
Down
Daily Indicators
Falling
21 HR EMA
1.3383
55 HR EMA
1.3397
Trend Hourly Chart
Down
Hourly Indicators
Rising fm o/s
13 HR RSI
33
14 HR DMI
-ve
Daily Analysis
Resumption of MT downtrend
Resistance
1.3485 - Jul 24 high
1.3445 - Last Fri’s high
1.3425 - Y’day’s high
Support
1.3358 - Y’day’s low
1.3332 - 61.8% proj. of 1.3549-1.3366 fm 1.3445
1.3295 - Nov 2013 low
. EUR/USD - 1.3372 … Despite staging a brief bounce to 1.3425 at European open on Tue, the single currency came under renewed selling pressure after the release of weaker-than-expected Italy’s Markit services PMI. Euro later tumbled to a near 9-mth low at 1.3359 on upbeat U.S. data n renewed tension in Ukraine.
. Looking at the bigger picture, euro’s breach of last Wed’s 8-1/2 month trough of 1.3366 confirms MT decline fm 2014 2-1/2 year peak at 1.3995 (May) has once again resumed n further weakness to 1.3332 (being 61.8% projection of 1.3549-1.3366 measured fm 1.3445) wud be forthcoming soon, below wud extend weakness twd 1.3295 (Nov 2013 low) later. On the upside, only a break of 1.3445 (reaction high after last Fri’s U.S. jobs report) wud violate recent series of lower highs n lower low fm 1.3995 n signal a temporary low is finally in place n may bring stronger retracement to 1.3485 n 1.3503 (Jun’s bottom).
. Today, in view current bearish analysis, selling euro on recovery in anticipation of further weakness is the way to go, however, low readings on the hourly oscillators shud prevent steep fall fm there n reckon previous daily sup at 1.3295 shud hold on 1st testing n yield rebound later.
DAILY EUR/USD TECHNICAL OUTLOOK
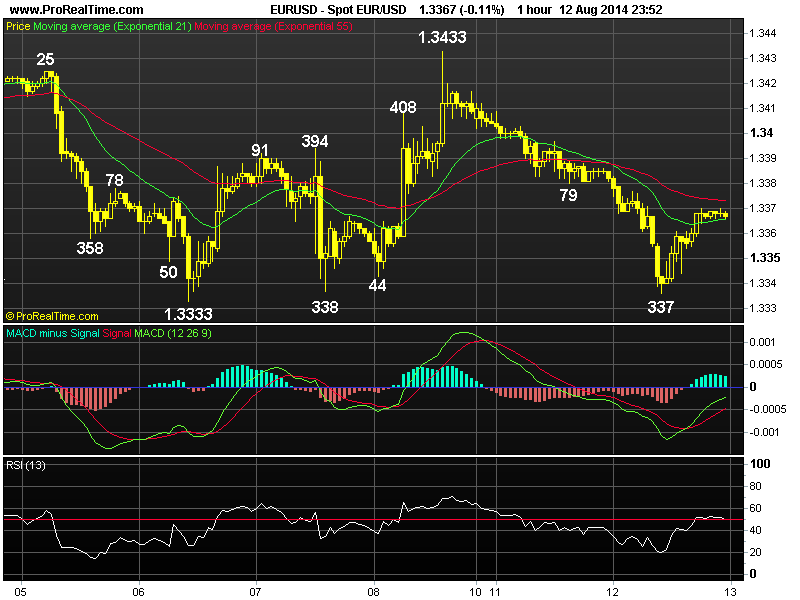
Last Update At 12 Aug 2014 23:59GMT
Trend Daily Chart
Down
Daily Indicators
Falling
21 HR EMA
1.3366
55 HR EMA
1.3373
Trend Hourly Chart
Sideways
Hourly Indicators
Turning up
13 HR RSI
49
14 HR DMI
-ve
Daily Analysis
Choppy consolidation b4 one more fall
Resistance
1.3445 - Aug 01 high
1.3433 - Last Fri’s high
1.3408 - Last Fri’s European high
Support
1.3333 - Last Wed’s fresh near 9-month low
1.3269 - 61.8% proj. of 1.3650-1.3366 fm 1.3445
1.3223 - 61.8% r of 1.2745-1.3995
. EUR/USD - 1.3366 … Euro ratcheted lower y’day after last Fri’s short-covering rally to 1.3433. Price tanked to an intra-day low at 1.3337 in European midday after weak ZEW economic sentiment b4 staging a recovery to 1.3370 in NY.
. Y’day’s fall to 1.3337 strongly suggests the correction fm last Wed’s near 9-month trough of 1.3333 has ended at 1.3433 last Fri n as long as 1.3408 holds, downside bias remains for MT downtrend fm May’s 2-1/2 year peak at 1.3995 to resume after choppy consolidation, n below 1.3333/37 sup area wud confirm, yield further weakness twds next daily chart obj. at 1.3295 (Nov 2013 low), however, as hourly oscillators wud display bullish convergences on next decline, suggesting steep fall below said daily sup is unlikely n reckon 1.3269 (61.8% proj. of 1.3650-1.3366 measured fm 1.3445) wud hold n yield a much-needed correction later. On the upside, only a breach of 1.3433 wud bring stronger retracement of the intermediate fall fm 1.3650 to 1.3454 but 1.3485/91 (prev. daily res n 50% r respectively) shud cap upside.
. Today, we’re cautiously selling euro on intra-day recovery in anticipation of such marginal fall. Abv 1.3408 risks 1.3433, break, 1.3445/50.
DAILY EUR/USD TECHNICAL OUTLOOK
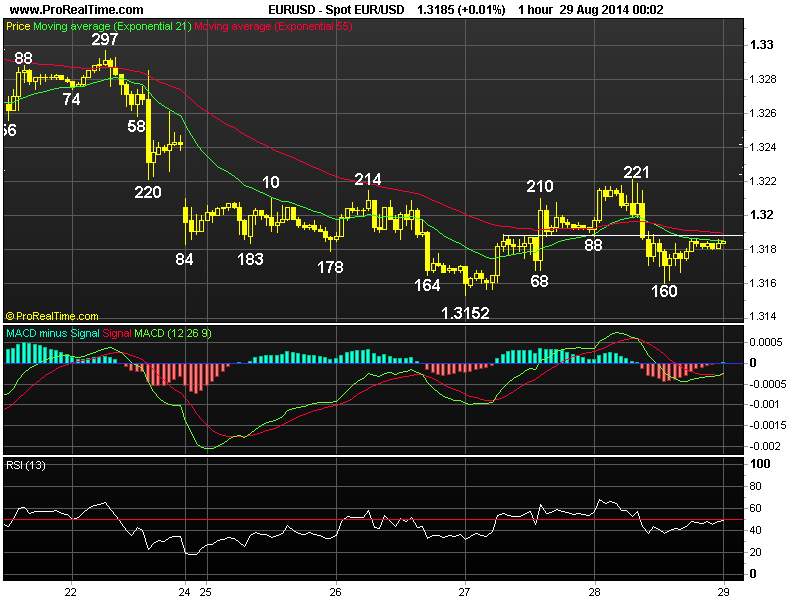
Last Update At 29 Aug 2014 00:29GMT
Trend Daily Chart
Down
Daily Indicators
Falling
21 HR EMA
1.3185
55 HR EMA
1.3190
Trend Hourly Chart
Sideways
Hourly Indicators
Bullish convergences
13 HR RSI
49
14 HR DMI
-ve
Daily Analysis
Consolidation b4 marginal fall
Resistance
1.3297 - Last Fri’s high
1.3242 - Last Thur’s low (now res)
1.3221 - Y’day’s high
Support
1.3152 - Wed’s fresh near 1-year low
1.3105 - Sep 06 low
1.3066 - 100% proj. of 1.3700-1.3333 fm 1.3433
. EUR/USD - 1.3185 … Although euro ratcheted higher to 1.3221 on short-covering at European open on Thur, renewed selling emerged after data showed EZ economic sentiment dropped in Aug n price retreated to 1.3199. Euro tumbled to 1.3160 due to renewed tensions in Ukraine n upbeat U.S. GDP b4 recovering.
. Looking at the hourly & daily charts, y’day’s strg retreat fm 1.3221 suggests correction fm Wed’s near 1-year low at 1.3152 has ended there n as long as 1.3221 holds, the MT downtrend fm May’s 2-1/2 year peak at 1.3995 to retrace the entire MT rise fm 2012 bottom at 1.2042 shud resume after consolidation, below said sup wud extend marginally to 1.3131 (being 61.8% r proj. of 1.3296-1.3152 measured fm 1.3220), however, as hourly indicators have already displayed prominent ‘bullish convergences’, reckon daily sup at 1.3105 wud hold on 1st testing n bring a much-needed correction. A daily close abv 1.3221 wud signal temp. low is made, then euro wud head twd 1.3280/90 next week b4 prospect of another fall.
. Today, we’re holding short in anticipation of one more decline n profit shud be taken on such a move as volatility may increase on month-end position adjustmet. Pay attention to the closely watched eurozone inflation at 09:00GMT !
DAILY EUR/USD TECHNICAL OUTLOOK
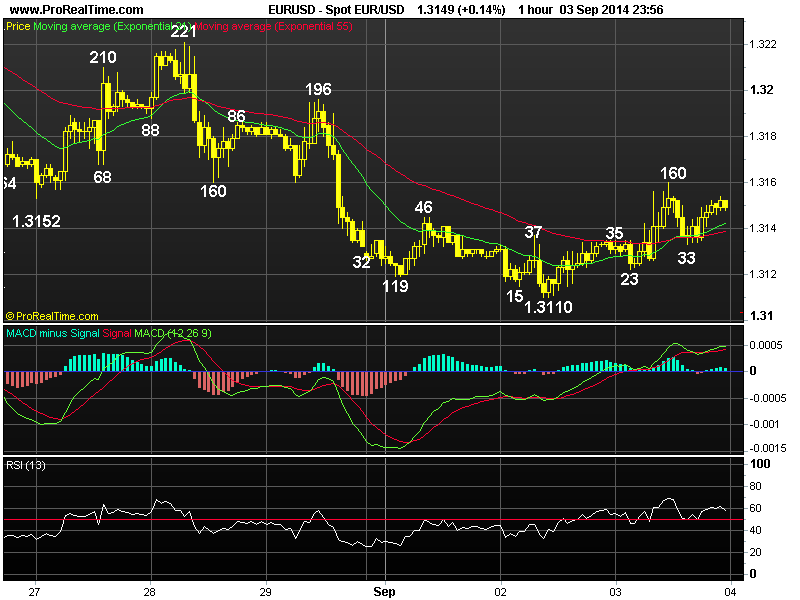
Last Update At 04 Sep 2014 00:03GMT
Trend Daily Chart
Down
Daily Indicators
Falling
21 HR EMA
1.3142
55 HR EMA
1.3139
Trend Hourly Chart
Sideways
Hourly Indicators
Rising
13 HR RSI
58
14 HR DMI
+ve
Daily Analysis
Consolidation b4 one more fall
Resistance
1.3221 - Last Thur’s high
1.3196 - Last Fri’s high
1.3160 - Y’day’s high
Support
1.3110 - Tue’s near 1-year low
1.3105 - Sep 13’ low
1.3066 - Jul 18 2013 low
. EUR/USD - 1.3149 … Despite Tue’s weakness to a fresh near 1-year low at 1.3110, euro rebounded on Wed on short-covering ahead of Thur’s ECB policy decision. Price jumped to 1.3156 on rumors of a ceasefire agreement between Ukraine n Russia. The single currency later rose to 1.3160 in NY b4 retreating.
. Looking at the hourly n daily charts, although euro’s recovery fm Tue’s low at 1.3110 suggests minor consolidation wud be seen, as long as res at 1.3196 (last Fri’s high) holds, the MT downtrend fm May’s 2-1/2 year peak at 1.3995 to retrace the entire MT rise fm 2012 bottom at 1.2042 shud resume later for a retest of previous daily sup at 1.3105 (Sep 13’ low), then 1.3066, this is a minor daily chart sup as well as 100% projection of intermediate fall fm 1.3700-1.3333 fm 1.3433. Having said that, as the hourly oscillators’ readings wud display very prominent bullish convergences on this move, reckon ‘psychological’ sup at 1.3000 wud hold n bring a long overdue minor correction.
. Today, selling on recovery in anticipation of one more fall is favoured, however, profit shud be taken on next decline. Abv said 1.3196 res wud risk correction to 1.3221, a daily close abv there wud yield stronger gain twd 1.3271.
DAILY EUR/USD TECHNICAL OUTLOOK
Last Update At 11 Sep 2014 00:14GMT
Trend Daily Chart
Down
Daily Indicators
Rising fm o/s
21 HR EMA
1.2919
55 HR EMA
1.2925
Trend Hourly Chart
Sideways
Hourly Indicators
Neutral
13 HR RSI
50
14 HR DMI
-ve
Daily Analysis
Choppy consolidation to continue
Resistance
1.3030 - Hourly chart
1.2990 - Last Fri’s high
1.2963 - Y’day’s high
Support
1.2883 - Y’day’s NY low
1.2860 - Tue’s fresh near 14-month low
1.2839 - 1.618 times ext. of 1.3700-1.3333 fm 1.3433
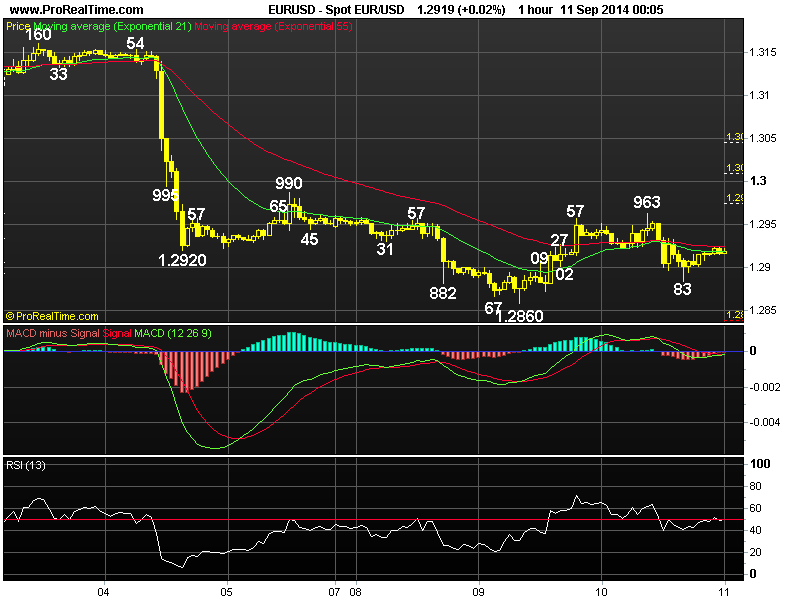
. EUR/USD - 1.2919 … The single currency briefly penetrated Tue’s high at 1.2957 to 1.2963 in European morning, however, renewed selling interest there capped euro’s upside n price ratcheted lower to session low of 1.2883 in New York midday b4 paring intra-day losses in NY afternoon.
. As mentioned in previous update, euro’s rebound fm a near fresh 14-month low at 1.2860 on Tue to 1.2963 signals a temp. bottom has been made there as the magnitude of this move was the largest in over a month, therefore, several days of consolidation is in store. As long as 1.2990 res (last Fri’s high) holds, out look remains bearish for the MT downtrend fm Jul’s 2-1/2 year peak at 1.3995 to retrace the entire MT rise fm 2012 bottom at 1.2042 to resume to 1.2839 (1.618 times extension of 1.3700-1.3333 measured fm 1.3433), however, as the hourly oscillators wud display prominent ‘bullish convergences’ on next fall, previous key daily sup at 1.2745 shud remain intact.
. Today, in view of abv consolidative view on euro, one can trade on both sides of the market n buy on dips for another rebound or sell on next intra-day up move twd 1.2980/90 res for subsequent retreat.
DAILY EUR/USD TECHNICAL OUTLOOK
Last Update At 18 Sep 2014 00:35GMT
Trend Daily Chart
Down
Daily Indicators
Rising fm o/s
21 HR EMA
1.2910
55 HR EMA
1.2935
Trend Hourly Chart
Down
Hourly Indicators
Rising fm o/s
13 HR RSI
28
14 HR DMI
-ve
Daily Analysis
Resumption of MT downtrend
Resistance
1.2943 - Y’day’s Euroepan morning low
1.2909 - Last Fri’s n Mon’s low
1.2860 - Last Tue’s low (now res)
Support
1.2835 - Intra-day low (Australia)
1.2772 - 61.8% proj. of 1.3221-1.2860 fm 1.2995
1.2745 - Apr 2013 low
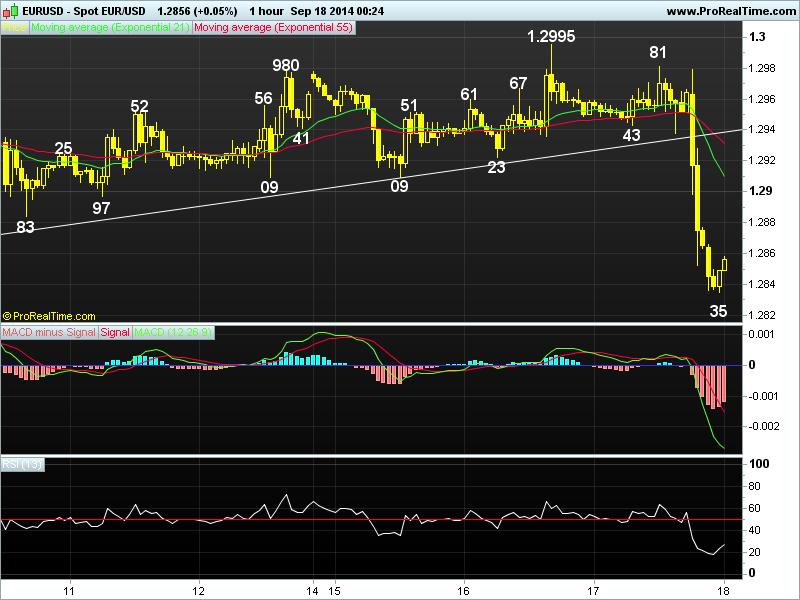
. EUR/USD - 1.2858… Despite euro’s brief bounce fm 1.2943 to 1.2981 in NY morning after the release of lower-than-expected US CPI data, the single currency nose-dived to 1.2898 after the release of dovish Fed’s policy statement n price later weakened to a fresh 14-month trough of 1.2835 in Australia.
. Looking at the hourly n daily charts, y’day’s of last Tue’s 1.2860 low to 1.2835 confirms MT downtrend fm May’s 2-1/2 year peak at 1.3995 to retrace entire LT rise fm 2012 bottom at 1.2042 (Jul) has once again resumed n further weakness to 1.2790/95 is now envisaged after minor consolidation, however, as the hourly oscillators’ readings are in oversold territory, reckon 1.2788, being 61.8% proj. of intermediate fall fm 1.3221-1.2860 measured fm 1.2995 wud limit downside n yield a much-needed rebound later. Looking ahead, euro is poised to re-test of previous daily sup at 1.2745 (Apr 2013) later this month n only abv 1.2909 signals at temp. low is made n may risk stronger retrace. twd 1.2985/95.
. Today, in view of abv bearish analysis, selling euro on intra-day recovery is the way to go as 1.2880/90 shud cap upside, however, profit shud be taken on subsequent decline.
DAILY EUR/USD TECHNICAL OUTLOOK
Last Update At 24 Sep 2014 00:27GMT
Trend Daily Chart
Down
Daily Indicators
Bullish convergences
21 HR EMA
1.2857
55 HR EMA
1.2860
Trend Hourly Chart
Sideways
Hourly Indicators
Falling
13 HR RSI
47
14 HR DMI
-ve
Daily Analysis
Consolidation b4 one more fall
Resistance
1.2982 - Last Wed’s high
1.2931 - Last Thur’s high
1.2901 - Y’day’s high
Support
1.2816 - Mon’s fresh 14-month low
1.2772 - 61.8% proj. of 1.3221-1.2860 fm 1.2995
1.2745 - Apr 04 2013 low
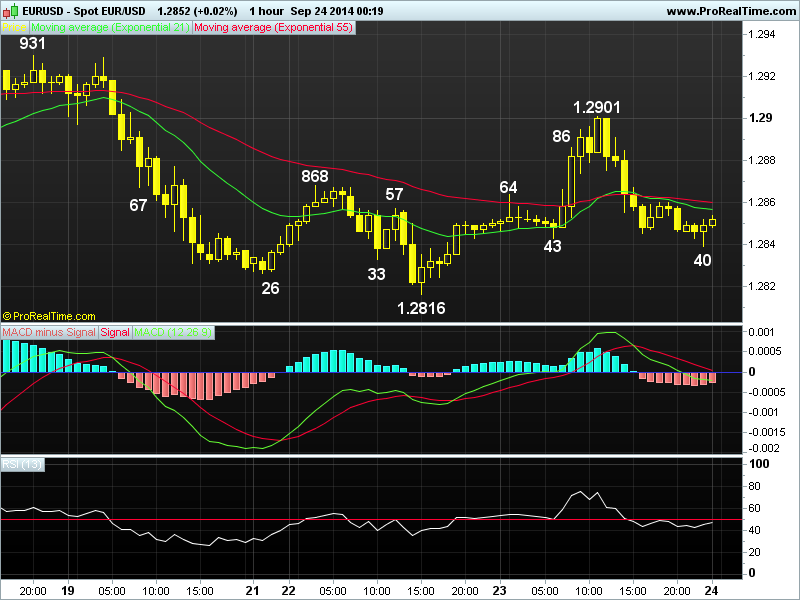
. EUR/USD - 1.2852… Despite Mon’s selloff to a fresh 14-month low at 1.2816, euro ratcheted higher on active short-covering in Europe on Tue after release of slightly higher German service PMI, however, renewed selling at 1.2901 at London midday capped rebound n knocked price lower to 1.2845 in NY.
. Euro’s rebound fm Mon’s fresh 14-month low of 1.2816 to 1.2901 y’day suggests MT downtrend fm May’s 2-1/2 year peak at 1.3995 has made a minor bottom there, however, subsequent retreat to 1.2845, then 1.2840 today suggests as long as 1.2901 res holds, downside bias remains for MT decline fm May’s 2-1/2 year peak at 1.3995 to retrace MT erratic upmove fm 1.2042 (2012 low) wud resume n extend marginal weakness to 1.2814 (50% projection of 1.3221-1.2860 measured fm 1.2995), however, as the hourly oscillators wud display prominent ‘bullish convergences’ on such move, suggesting steep fall below there is unlikely n reckon 1.2772 (61.8% projection of 1.3221-1.2860 fm 1.2995) wud hold n yield a much needed
minor correction.
. Today, selling euro on recovery for one more is cautiously favoured n only abv 1.2901 wud risk stronger correction to chart obj/res at 1.2931.
DAILY EUR/USD TECHNICAL OUTLOOK
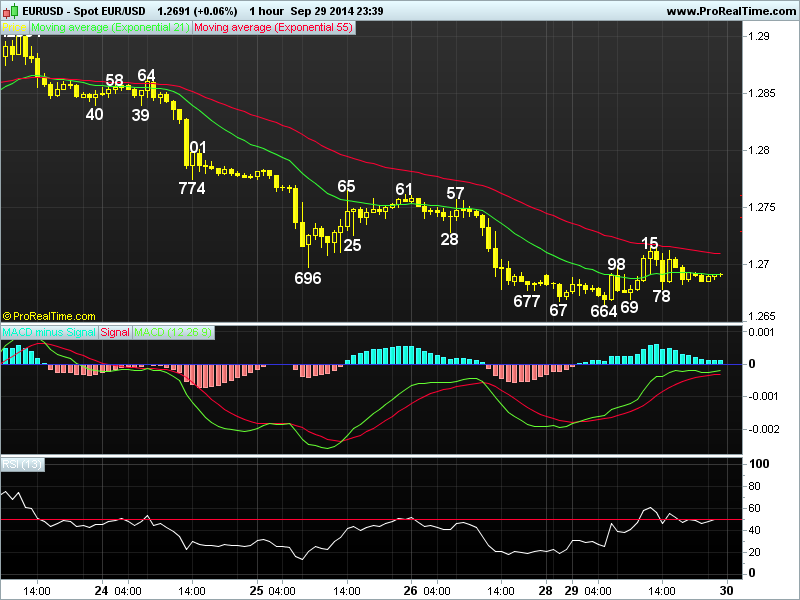
Last Update At 29 Sep 2014 23:39GMT
Trend Daily Chart
Down
Daily Indicators
Bullish convergences
21 HR EMA
1.2691
55 HR EMA
1.2709
Trend Hourly Chart
Down
Hourly Indicators
Bullish convergences
13 HR RSI
49
14 HR DMI
-ve
Daily Analysis
Consolidation b4 one more fall
Resistance
1.2801 - Hourly chart
1.2765 - Last Thur’s NY high
1.2728 - Last Fri’s European morning low
Support
1.2664 - Y’day’s low
1.2641 - 61.8% proj. of 1.3433-1.2860 fm 1.2995
1.2600 - 2.236 times ext. of 1.3995-1.3503 fm 1.3700
. EUR/USD - 1.2691… Although Fri’s close near the day’s low pressured the single currency in Asia on Mon, price briefly weakened to a fresh 22-month trough of 1.2664 just ahead of European open, short-covering lifted the pair to 1.2715 in NY morning b4 coming off to 1.2678 b4 moving sideways in NY afternoon.
. Looking at the hourly & daily charts, although said Mon’s low at 1.2664 was accompanied by ‘bullish convergences’ on the hourly indicators, as long as 1.2725/28 (prev. sup, now res) holds, the MT downtrend fm May’s 2-1/2 year peak 1.3995 is en route to next chart obj. at at 1.2661 (Nov 13 2012 low), however, reckon 1.2600 (2.236 times extension of 1.3995-1.3503 measured fm 1.3700) wud hold on 1st testing ahead of Thur’s ECB policy meeting n bring a much-needed minor correction. On the upside, a daily close abv 1.2765 wud be the 1st signal temporary low is made n yield stronger gain twd 1.2816, however, res at 1.2901 (last week’s high on Tue) shud remain intact. In view of abv bearish analysis on euro, selling euro on recovery is the way to go.
. Today, we’re holding a short position for one more fall but profit shud be taken on subsequent decline.
[B]DAILY EUR/USD TECHNICAL OUTLOOK[/B]
Last Update At [B]07 Oct 2014[/B] [I]00:30GMT[/I]
[B]Trend Daily Chart[/B]
Down
[B]Daily Indicators[/B]
Turning up
[B]21 HR EMA [/B]
1.2601
[B]55 HR EMA[/B]
1.2591
[B]Trend Hourly Chart[/B]
Near term up
[B]Hourly Indicators[/B]
Easing fm o/bot
[B]13 HR RSI [/B]
72
[B]14 HR DMI[/B]
+ve
[B]Daily Analysis[/B]
Marginal rise b4 strg retreat
[B]
Resistance[/B]
1.2748 - 50% r of 1.2995-1.2500
1.2699 - Last Thur’s high
1.2675 - Y’day’s high
[B]Support[/B]
1.2608 - 38.2% r of 1.2500-1.2675
1.2571 - Last Tue’s low
1.2542 - Y’day’s NY low
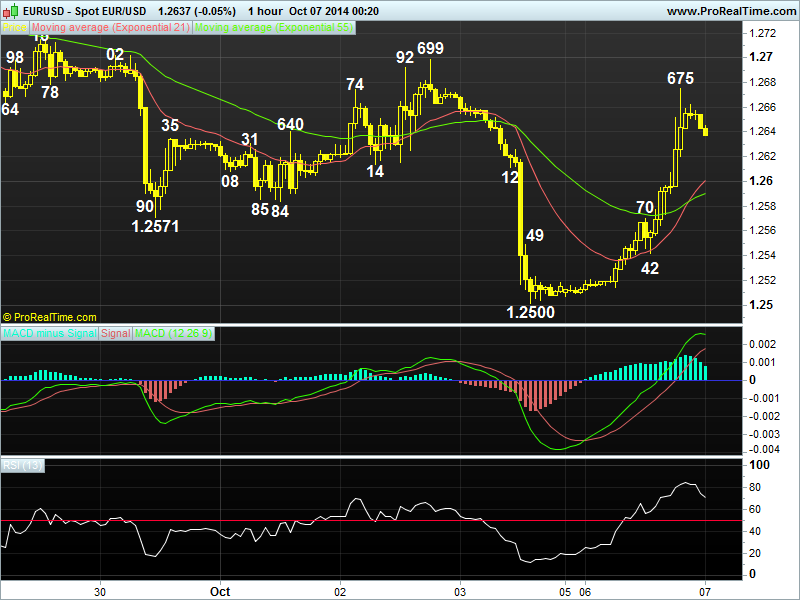
. [B] EUR/USD[/B] - 1.2635 … Although the euro remained under pressure in Asia on Mon after last Fri’s selloff to a fresh 2-year low at 1.2500, price ratcheted higher in Europe n then jumped in U.S. session on active short-covering. Price rallied to as high as 1.2675 near New York close b4 easing at Asian open today.
. Looking at the hourly n daily charts, y’day’s rally to 1.2675 strongly suggests MT downtrend fm May’s 2-1/2 year peak at 1.3995 has formed a temporary bottom there n as long as 1.2570/71 (y’day’s NY res, now sup n prev. low) holds, upside bias remains for further gain to 1.2699 res (post-ECB rate meeting high unchanged last Thur), break wud bring stronger retracement of MT intermediate decline fm 1.2995 to 1.2748 (50% r) n possibly twds 1.2765 res, however, reckon 1.2806 (61.8% r) shud cap upside this week n yield retreat later.
. In view of near term bullish scenario, buying euro on dips in anticipapation of further gain is favoured. However, as hourly indicators’ readings wud be in o/bot territory on next rise, selling euro on upmove for a strg retreat is also appropriate. On the downside, a daily close below 1.2571 wud signal correct tion fm 1.2500 has possibly ended n yield weakness twd 1.2500 later this week.
DAILY EUR/USD TECHNICAL OUTLOOK
Last Update At 15 Oct 2014 00:38GMT
Trend Daily Chart
Down
Daily Indicators
Turning up
21 HR EMA
1.2664
55 HR EMA
1.2674
Trend Hourly Chart
Near term down
Hourly Indicators
Falling
13 HR RSI
39
14 HR DMI
-ve
Daily Analysis
Consolidation with downside bias
Resistance
1.2791 - Last Thur’s high
1.2769 - Y’day’s high in Australia
1.2700 - Mon’s hourly res
Support
1.2605 - Last Fri’s low
1.2584 - Last Tue’s low
1.2500 - Oct’s fresh 2-year low
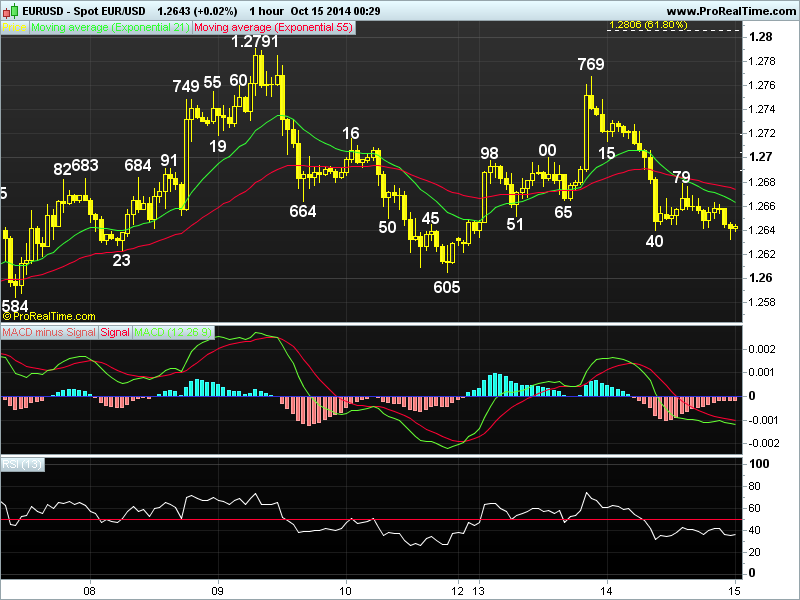
. EUR/USD - 1.2643 … Despite euro’s brief jump to 1.2769 in Aust. y’day on short covering, the pair ratcheted lower in Asia n then dropped sharply to 1.2640 in Europe after a surprise sharp fall in German ZEW economic sentiment. Euro staged a minor recovery to 1.2679 in New York morning b4 falling again.
. Looking at the hourly chart, y’day’s selloff strongly suggests correction fm Oct’s 2-year trough at 1.2500 has possibly ended at 1.2791 n further ‘choppy’ consolidation with downside bias wud be seen, a daily close below 1.2605 (last Fri’s low) wud add credence to this view n yield re-test of 1.2500 later next week, break wud bring resumption of MT fall fm May’s 2-1/2 year peak at 1.3995 to projected downside target at 1.2412 (2.618 times of 1.3995-1.3505 fm 1.3700). On the upside, only abv 1.2791 res brings stronger retracement of MT rise twd 1.2860 (prev. low, now res).
. In view of abv analysis, selling euro on recovery in anticipation of further weakness is favoured. A rise abv 1.2700 wud prolong near term gyration inside 1.2605-1.2791 broad range n another rebound to 1.2769 may be seen, break wud bring another corrective rise to 1.2791.
DAILY EUR/USD TECHNICAL OUTLOOK
Last Update At 22 Oct 2014 00:33GMT
Trend Daily Chart
Sideways
Daily Indicators
Turning up
21 HR EMA
1.2741
55 HR EMA
1.2761
Trend Hourly Chart
Near term down
Hourly Indicators
Falling
13 HR RSI
32
14 HR DMI
-ve
Daily Analysis
Consolidation with downside bias
Resistance
1.2888 - Last Wed’s 3-week high
1.2840 - Y’day’s high n last Thur’s NY high
1.2784 - Y’day’s hourly res
Support
1.2706 - Last Thur’s low
1.2669 - Last Tue’s European morning high
1.2625 - Last Wed’s low
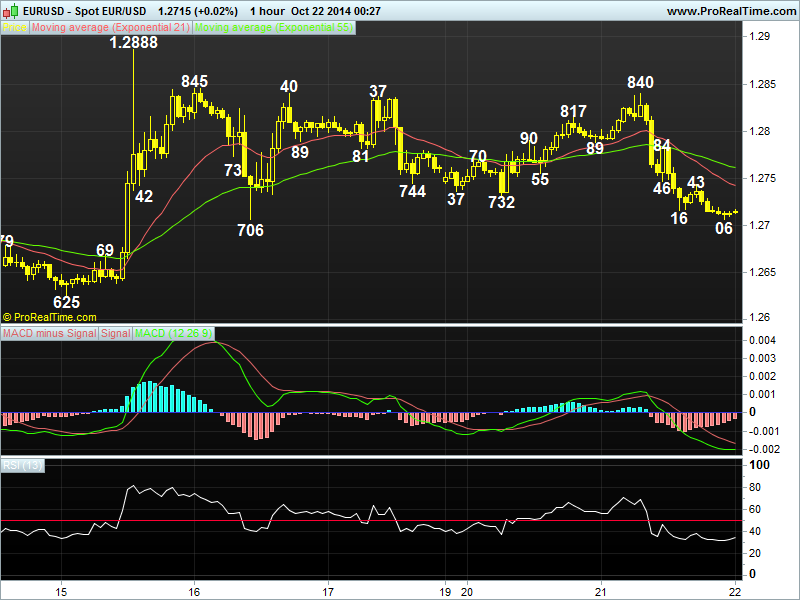
. EUR/USD - 1.2715… Despite euro’s initial brief rise to 1.2840 in Europe on Tue, the single currency n then tumbled after Reuters reported the ECB was planning on corporate bond purchase as early as Dec. The pair weakened to as low as 1.2715 near NY close n then marginally lower to 1.2706 in Australia today.
. Although last week’s rally to 1.2888 (Wed) signals the MT downtrend fm 2014 2-1/2 year peak at 1.3995 (May) has formed a temporary bottom at Oct’s 2-year low at 1.2500, y’day’s selloff suggests 1st leg of said corrective upmove has ended there n as long as hourly chart res at 1.2784 holds, consolidation with downside bias remains, a firm breach of 1.2706 sup (reaction low fm last Wed’s 1.2888 high) wud add credence to the abv view n bring further weakness twd ‘dynamic’ sup at 1.2648 (this is 61.8% r of 1.2500-1.2888) but reckon pivotal sup at 1.2605 wud remain intact. On the upside, only a rise abv 1.2888 res wud bring a stronger correction to 1.2958, this a ‘minimum’ 38.2% r of MT intermediate fall fm 1.3700 (Jul high).
. Today, we’re holding a short position in anticipation of further weakness n wud take profit on next decline as 1.2648 shud remain intact.
WEEKLY EUR/USD TECHNICAL OUTLOOK
Last Update At 09 Nov 2014 23:57GMT
Trend Daily Chart
Down
Daily Indicators
Bullish convergences
21 HR EMA
1.2432
55 HR EMA
1.2441
Trend Hourly Chart
Sideways
Hourly Indicators
Rising
13 HR RSI
62
14 HR DMI
+ve
Daily Analysis
Initial rise b4 retreat
Resistance
1.2577 - Last Tue’s high
1.2533 - Last Thur’s high
1.2495 - Last Thur’s European morning low
Support
1.2408 - Lst Fri’s Euroepan morning high
1.2357 - Last Fri’s 26-month low
1.2311 - 61.8% proj. of 1.3433-1.2500 fm 1.2888
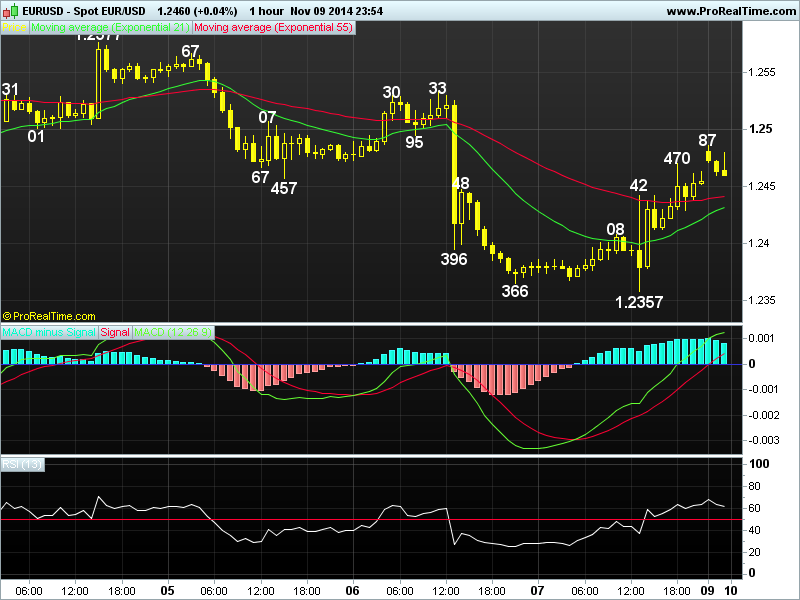
. EUR/USD - 1.2460 … The single currency continued its recent downtrend n hit a 2-year low at 1.2439 at the start of last week, despite staging a short-covering rebound to 1.2577 Tue, renewed selling emerged n knocked price to 1.2374 after ECB Draghi’s dovish comments Thur, then 1.2357 on Fri b4 rebounding.
. Looking at bigger picture 1st, despite euro’s resumption of the MT fall fm May’s 2-1/2 year peak at 1.3995 to a fresh 2-year bottom at 1.2357,as aforesaid low was also accompanied by prominent bullish convergences on the hourly & daily oscillators n subsequent bounce to 1.2470 had pushed the hourly macd abv the zero line, suggesting consolidation with initial upside bias wud be seen. However, a daily close abv 1.2577 is needed to ‘violate’ recent series of lower highs n lower lows n yield stronger retracement twd next upside obj. at 1.2771 later this month. On the downside, below 1.2357 wud yield weakness to 1.2311 (61.8% proj. of 1.3433-1.2500 measured fm 1.2888) but 1.2146 shud hold fm here.
. Today, euro’s gain to 1.2487 in NZ suggests 1-2 days of choppy sideways trading is in store, in view of abv analysis, one can trade the pair on both sides of the market as only below 1.2378 wud bring re-test of 1.2357.
DAILY EUR/USD TECHNICAL OUTLOOK
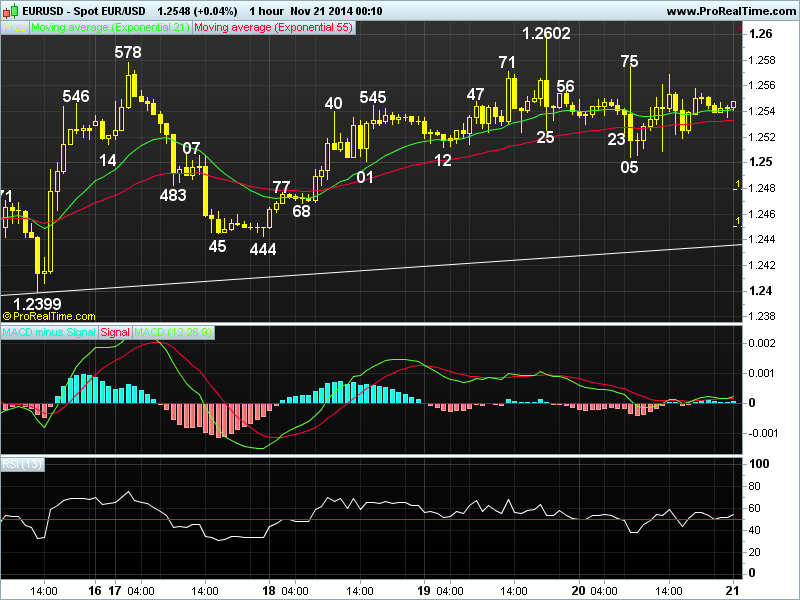
Last Update At 21 Nov 2014 00:18GMT
Trend Daily Chart
Down
Daily Indicators
Bullish convergences
21 HR EMA
1.2541
55 HR EMA
1.2533
Trend Hourly Chart
Sideways
Hourly Indicators
Neutral
13 HR RSI
55
14 HR DMI
+ve
Daily Analysis
Chopy sideways trading to continue
Resistance
1.2685 - 61.8% r fm 1.2788-1.2357
1.2602 - Wed’s NY high
1.2575 - Y’day’s high
Support
1.2505 - Y’day’s low
1.2480 - 50% r of 1.2357-1.2602
1.2444 - Tue’s low
. EUR/USD - 1.2547… The single currency continued to whip around in intra-day trade on Thur. Despite staging a brief bounce fm 1.2524 to 1.2575, euro briefly dived to 1.2505 after release of downbeat German & EZ PMIs, however, the pair rebounded again to 1.2769 in New York morning b4 moving sideways.
. Looking at the hourly chart n daily charts, despite Wed’s brief breach of Mon’s high of 1.2578 to 1.2602, subsequent retreat to 1.2505 suggests the early 3-legged corrective upmove fm Nov’s 26-month trough at 1.2357 has ‘possibly’ formed a temporary top there n few days of choppy consolidation is in store, how ever, below 1.2501/05 sup (Tue’s NY low n y’day’s low respectively) is needed to confirm n yield stronger pullback to 1.2444/51 (being Tue’s low n 61.8% r of 1.2357-1.2602). Looking ahead, only breach of pivotal sup at 1.2399 wud indicate MT decline fm May’s 2-1/2 year peak at 1.3995 has once again resumed n bring retest of 1.2357 low next week. Abv 1.2602 wud send euro to 1.2622 n later 1.2685, being 50% n 61.8% r respectively of intermediate fall fm 1.2888-1.2357.
. Today, we are standing ahead initially n may give a buy recommendation if price holds abv 1.2505 for a move to 1.2622.
