DAILY TECHNICAL OUTLOOK ON GBP/USD
20 Aug 2013 00:16GMT
Trend Daily Chart
Sideways
Daily Indicators
Rising
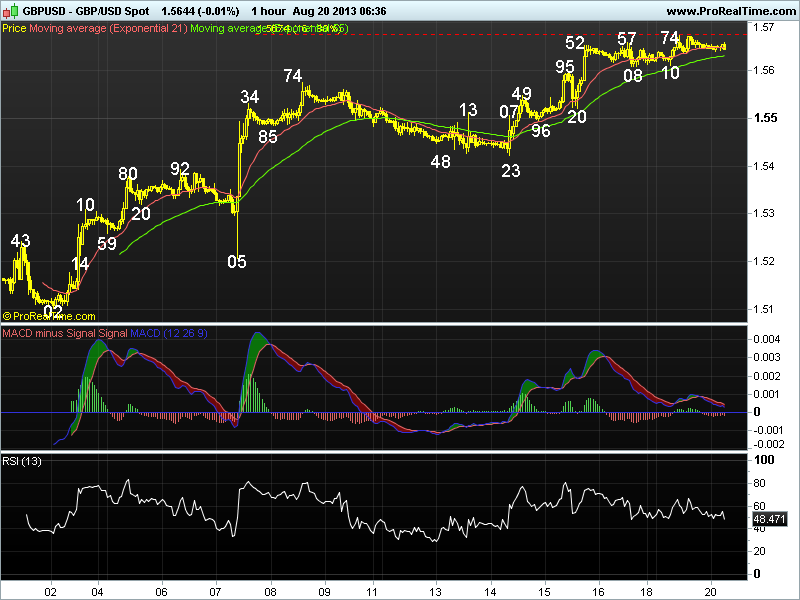
21 HR EMA
1.5647
55 HR EMA
1.5625
Trend Hourly Chart
Up
Hourly Indicators
Bearish divergences
13 HR RSI
51
14 HR DMI
+ve
Daily Analysis
Marginal rise b4 correction
Resistance
1.5753 - Jun 17 high
1.5723 - Equality proj. of 1.4814-1.5435 fm 1.5102
1.5674 - Y’day’s high
Support
1.5608 - Last Fri’s NY sup
1.5520 - Last Thur’s NY low
1.5496 - Last Thur’s Australian low
. GBP/USD - 1.5650 … The British pound found renewed interest buying at
1.5610 (just abv last Fri’s NY sup at 1.5608) at European opening n rose to a
near 2-month high at 1.5674 in European session y’day in tandem with euro’s
strength after hawkish comments fm Bundesbank b4 trading sideways in NY.
. Looking at the hourly n daily chart, recent series of higher lows n
higher highs fm Jul’s 3-year low at 1.4814 remains in progress n as current
hourly n daily indicators are rising, suggesting as long as 1.5608 sup holds,
one more rise to 1.5700/10 is likely, however, as bearish divergences wud appear
on hourly oscillators on such move, previous key daily res at 1.5753 (Jun 17
high) is expected to hold on 1st testing n yield a much-needed minor correction
later today or tomorrow.
. In view of the abv analysis, we’re cautiously selling cable on next
upmove in anticipation of a retreat to 1.5608/10, break wud confirm a top has
finally been made n yiled retrace. of intermediate rise fm 1.5423 to 1.5578
(minimum 38.2% r) n then twds 1.5549 (50% r) but sup at 1.5520 wud hold.