DAILY TECHNICAL OUTLOOK ON GBP/USD
23 Aug 2013 00:08GMT
Trend Daily Chart: Sideways
Daily Indicators: Rising
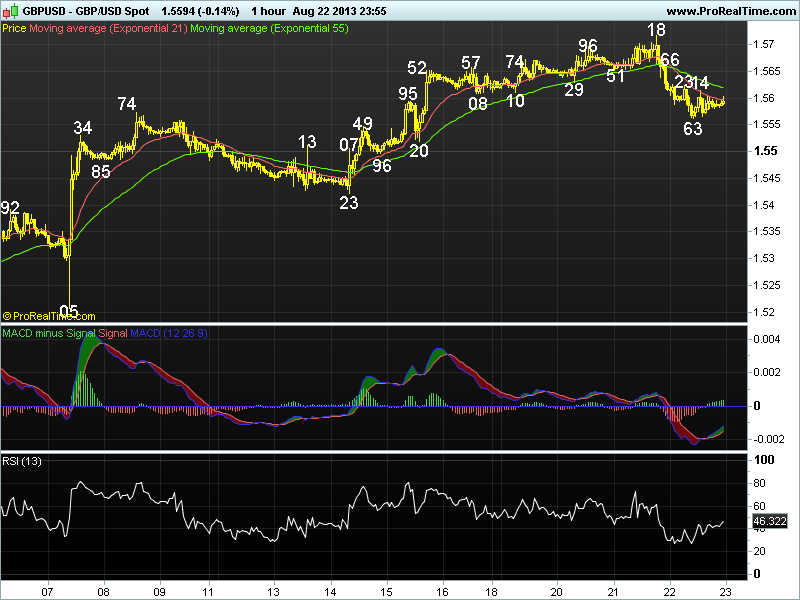
21 HR EMA: 1.5597
55 HR EMA: 1.56620
Trend Hourly Chart: Near term down
Hourly Indicators: Falling
13 HR RSI: 47
14 HR DMI: -ve
Daily Analysis: Consolidation with downside bias
Resistance
1.5753 - Jun 17 high
1.5718 - Wed’s high
1.5666 - Wed’s NY res
Support
1.5563 - Y’day’s low
1.5520 - Last Thur’s NY low
1.5496 - Last Thur’s Australian low
. GBP/USD - 1.5600 … The British pound ratcheted lower in Asia n Europe y’day n cable dropped to an intra-day low of 1.5563 on dlr’s broad-based strength, however, the pound rebounded briefly to 1.5614 on short-covering after the release of worse-than-expected U.S. jobless claims data b4 trading sideways.
. As mentioned in our previous update, the reversal fm Wed’s high at 1.5718 signals recent erratic upmove fm Jul’s 3-year low at 1.4814 has formed a temp. top there n as hourly technical indicators are still declining, suggesting a much-needed correction has taken place n as long as 1.5666 (Wed’s NY res) holds, choppy consolidation with downside bias remains for further weakness twds 1.5520 sup (last Thur’s NY low) but anticipated low readings on hourly oscillators shud limit downside to 1.5483 (38.2% r of 1.5102-1.5718) n yield rebound later.
. Today, selling cable again on intra-day recovery in anticipation of further weakness is favoured n only a breach of 1.5666 res wud signal the pullback is over instead n yield resumption of aforesaid upmove fm 1.4814 to 1.5718, abv wud encourage for re-test of key daily res at 1.5753 (Jun).