WEEKLY TECHNICAL OUTLOOK ON USD/JPY
27 Oct 2013 23:44GMT
Trend Daily Chart : Sideways
Daily Indicators : Turning down
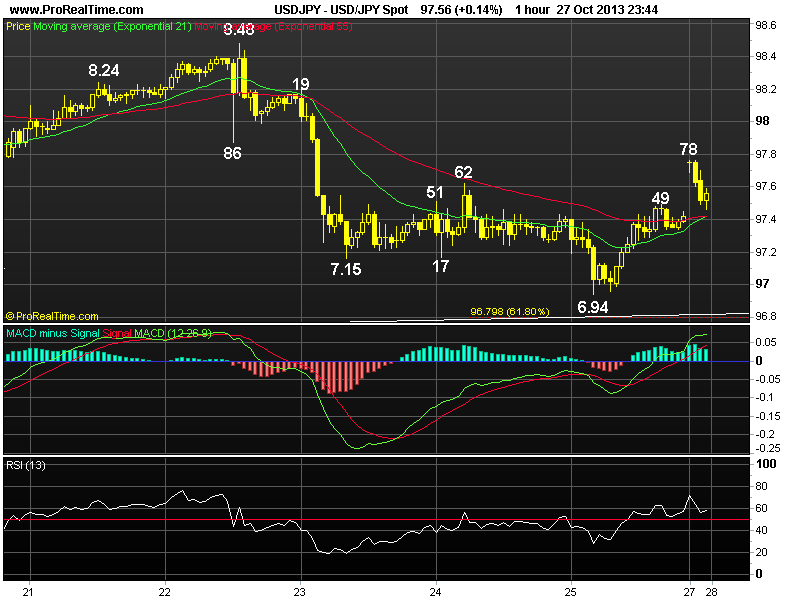
21 HR EMA : 97.41
55 HR EMA : 97.42
Trend Hourly Chart : Sideways
Hourly Indicators : Rising
13 HR RSI : 56
14 HR DMI : +ve
Daily Analysis : Choppy trading to continue
Resistance
98.19 - Last Wed’s high
97.86 - Last Wed’s NY low. now res
97.78 - Intra-day high in Aust.
Support
97.15 - Last Wed’s low
96.94 - Last Fri’s low
96.55 - Oct 07 low
. USD/JPY - 97.51 … Despite initial cross-inspired recovery to 98.48 on
Tue due to rebound in the N225, sudden spike in Chinese short-term rates spoofed investors n caused a slide in the N225, traders bot yen broadly as safe-haven currency, pushing the pair to a 2-week low of 96.94 Fri b4 staging a recovery.
. Let’s look at the bigger picture 1st, dlr’s recent broad sideways move is
set to continue for rest of this week as price wud remain confined recent established range of 95.81-100.62 n only a daily close abv or below either side wud signal a major ‘breakout’ has taken place, so until then, one shud not too excited when price is approaching twd the upper or lower level of aforesaid range. On the downside, below 95.81 wud be 1st signal downside break has occured n test of 93.75 (reaction fm 2013 4-1/2 year peak at 103.74) wud follow in Nov/Dec. Only abv 99.01 wud shift risk to upside n yield subsequent rebound twd 100.62.
. Today, intra-day gap-up open to 97.78 in Aust. suggests decline fm 99.01 has made a low n 1-2 days of consolidation is seen with upside bias but 98.22 (61.8% r) shud cap present rise n yield another fall later.