WEEKLY TECHNICAL OUTLOOK ON GBP/USD
09 Sep 2013 02:00GMT
Trend Daily Chart: Sideways
Daily Indicators: Neutral
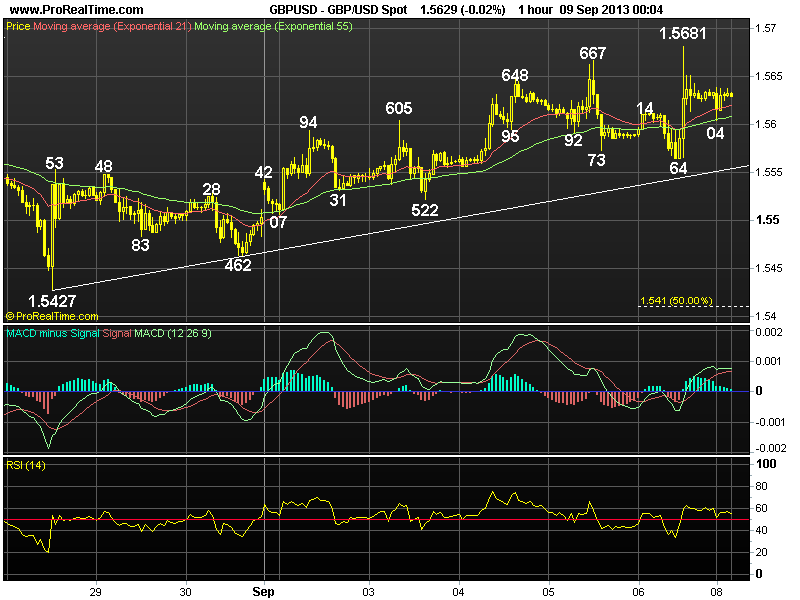
21 HR EMA: 1.5620
55 HR EMA: 1.5608
Trend Hourly Chart: Up
Hourly Indicators: Bearish divergences
13 HR RSI: 58
14 HR DMI: +ve
Daily Analysis: Consolidation with upside bias
Resistance
1.5753 - JUn 17 high
1.5718 - Augs’ high (21)
1.5681 - Last Fri’s high
Support
1.5564 - Last Fri’s low
1.5522 - Last Tue’s low
1.5462 - Aug 30 low
. GBP/USD - 1.5633… Trading cable proved to be tricky due to its daily large swings last week. Price ratcheted higher fm 1.5507 (Mon) to 1.5681 Fri on dlr’s broad-based weakness after U.S. payrolls were less than market forecast.
. Looking at the daily chart, sterling’s erratic rise fm 1.5427 signals early retreat fm Aug’s peak at 1.5718, although strg, has ended there n abv said res wud extend upmove fm 2013 3-year trough at 1.4814 (Jul) to test chart obj. at 1.5753, abv wud encourage for gain to 1.5781, this is the ‘natural’ 50% r of the MT fall fm 1.6747 (2011 top), abv needed to extend aforesaid move to 1.5879, being 50% proj. of 1.4814 to 1.5718 measured fm 1.5427. Having said that, as the daily indicators wud display ‘bearish divergences’ on such move, reckon 1.5986 (61.8% proj. ) wud remain intact. On the downside, only below 1.5522 wud abort abv mildly bullish scenario n may yield re-test of 1.5427 later.
. Today, although sterling’s retreat fm said Fri’s 1.5681 high in NY sug- gests initial consolidation is in store in Asia, below 1.5564 needed to confirm temp. top is made n yield retrace. twd 1.5522 whilst abv 1.5681 risks 1.5718.