Adidas is a German multinational corporation designing and manufacturing shoes, clothing and accessories. Created in 1934 by Adolf Dassler and headquartered in Herzogenaurach, Germany, the company is the largest sportswear manufacturer in Europe. Adidas is a part of both DAX40 and of SX5E indices. From the all-time lows, Adidas is showing a strong bullish behavior. In particular, from the 2008 lows it has gained more than 10x in value. In the initial article from January 2021, we were calling for a new cycle up. We were right, Adidas has printed a new all-time high at 336.25. In this blog, we provide an update.
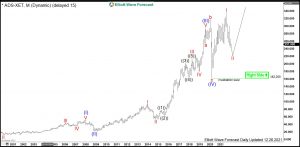
Adidas Monthly Elliott Wave Analysis 12.28.2021
The monthly chart below shows the Adidas stock $ADS traded at XETRA. From the all-time lows, the stock price has developed a cycle higher in blue wave (I) of super cycle degree towards January 2008 highs at 51.63. From there, a correction lower in blue wave (II) has retraced part of the rise. It has printed a bottom on November 2008 at 21.22. From November 2008 lows, a cycle in wave (III) has extended towards August 2019 highs at 296.75. Hereby, the extension beyond 4.236 qualifies the cycle as a 3rd wave. From the August 2019 highs, a correction lower in wave (IV) has unfolded as an expanded flat structure towards the March 2020 lows at 162.20.
From the March 2020 lows, a new cycle in wave (V) is in progress and has broken to the new all-time highs. The minimum target higher being 328.80 has been already met. However, $ADS might have ended only the wave I of (V). Therefore, investors can buy Adidas in a pullback expecting more upside beyond 328.80 target.
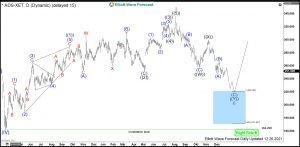
Adidas Daily Elliott Wave Analysis 12.28.2021
The daily chart below shows in more detail the advance higher in red wave I of blue wave (V) and the pullback in wave II. First, from the March 2020 lows at 162.20, a cycle higher in red wave I has unfolded as an impulse and printed its top in August 2021 at 336.25. Hereby, wave ((1)) shows the extension. Currently, a correction lower in red wave II is taking place and should find support in 3, 7 or 11 swings for more upside in wave III of (V). Right now, while $ADS is trading below 300.25, the prices can fall into the 220.76-171.54 area. There, buyers can enter the market for a rally to the new all-time highs.
Source: $ADS : Rally in Adidas Sportswear Stock Should Continue

