Down Down and Down! Couple of big drops and my circuit breakers hit. It is easy to see recovery from such a drop in back test however it’s hard in live account. I’m trusting my back test and still not updating the stop loss strategy. Will see how it will go.
Oanda seems to be down so not posting any report this week. Anyway there is nothing exciting to post this week.
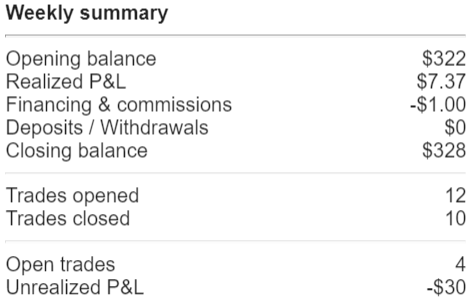
My account was around $300 last week because of big drops however it has recovered 50% of my losses. I have two trades going next week. From my past experience, over the weekend positions turned out to be a winner. Will see how they go.
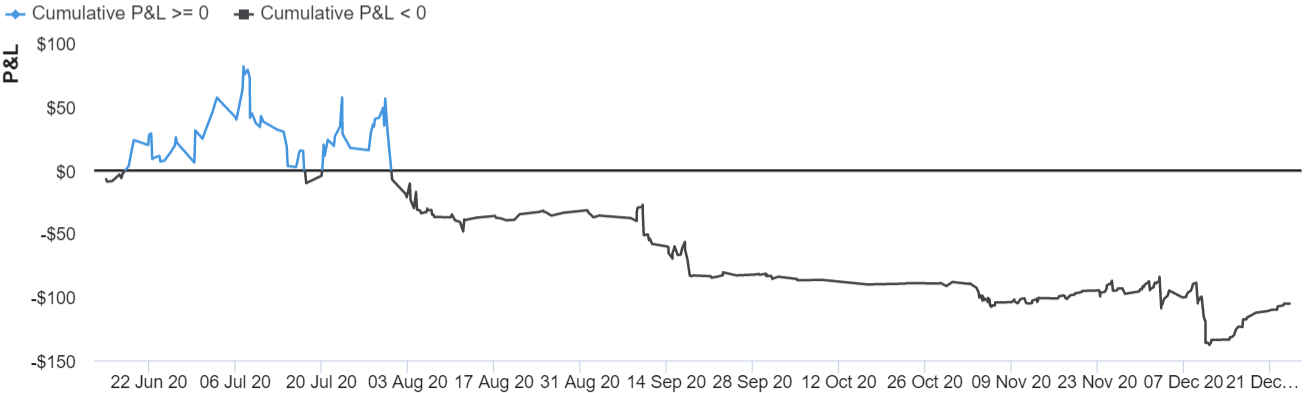
Looking at the stats my strategy has a high win rate. However, the losses are out of control. That is what I have to work on. But my back test results have shown that even though with big losses in the long run my account will be positive. I think I need to trust my back tests results after seeing this week’s gains. Will see how long this trust will last. It’s hard to see money going under
From last week’s two trades one turned out to be positive and other trade is still hanging in there. I’m under the water this week. Will see how it will turn out in the last week of the year.
This is my last post of this year. See you in 2021. Have a safe and happy holiday and a happy new year!
@CavaliereVerde, I have coded my own back test mechanism. The max data that I have test is 15 years because that is the max Oanda provides. For my current strategy, I’m testing 5 years of data as time frame is M30 and I think that’s enough sample size.
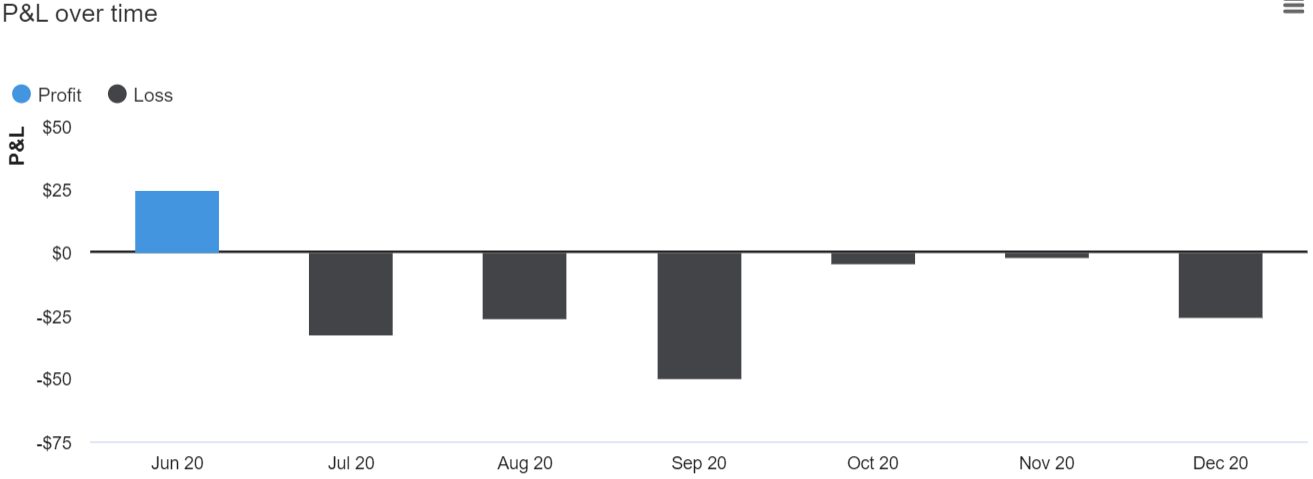
I started with $200 then added some more money to make it $435. At the end of year I’m 25% down in 6 months of live trading. I think the good thing is I haven’t blown up my account. I started with one strategy and ended up with another. I have added some money to start 2021 with $1000.
This year I had only one positive month and the rest were all in red.
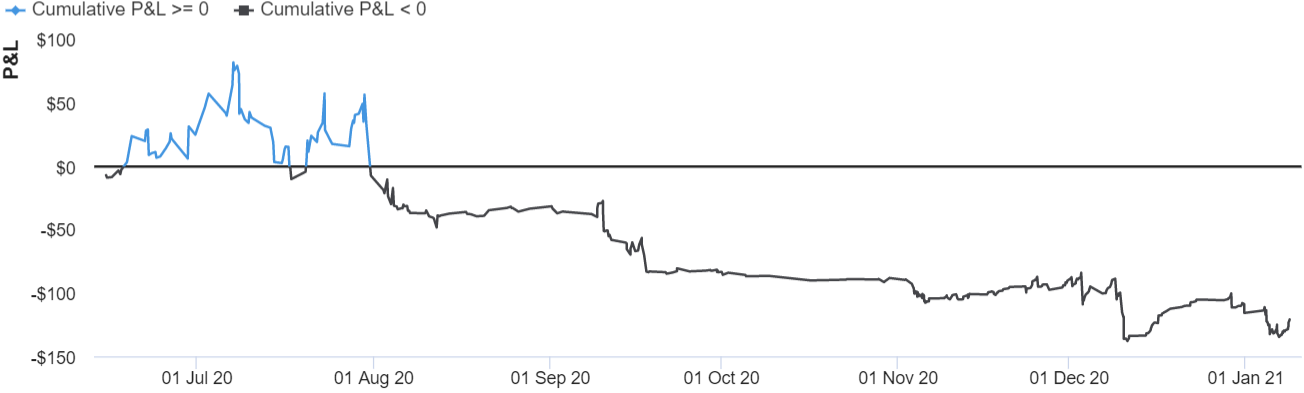
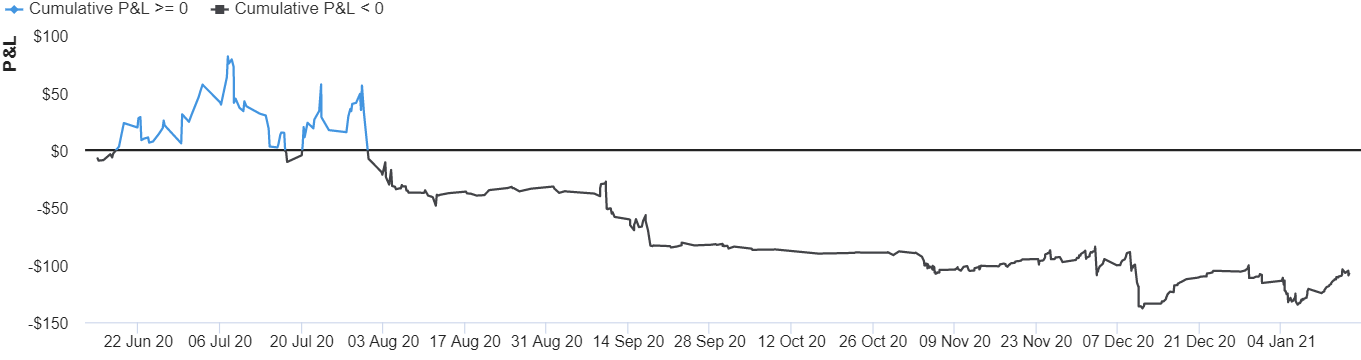
I started live trading EURUSD on June 14, 2020 with $200. My strategy was pretty simple to identify candlesticks patterns by analyzing 4-5 candles on H4. My back test results with this strategy were magnificent. So I decided to trade without putting proper stop strategy. By July I was up 30%. Wo ho! Flying above the ground! Went through some drawdowns however was able to recover. One more reason to fly. It was just a matter of time my account started going down and I was of the impression it will come back only to realize it is going down more. Hence revisited strategy and started looking for risk management. Put some risk management strategies and got it under control. However, it was under control but wasn’t recovering.
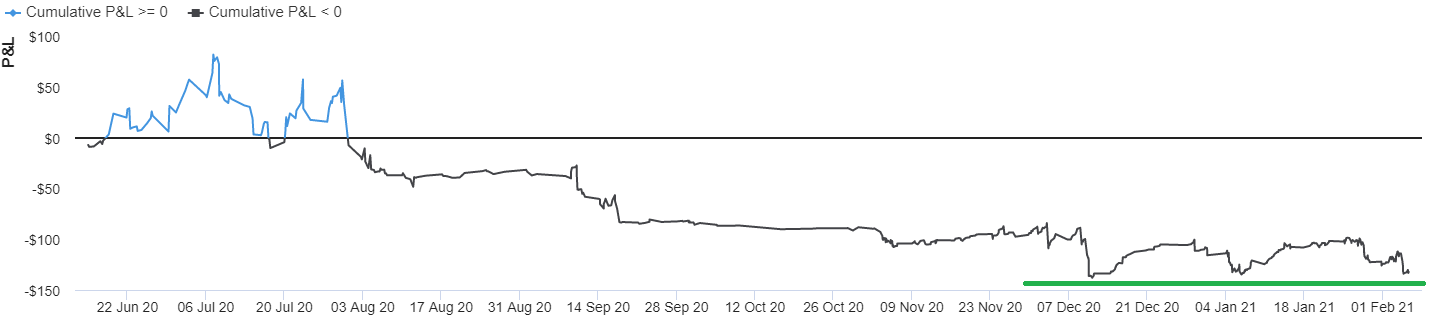
Starting October I started trading the M30 time frame. The strategy is to catch small profits based on wicks of 10 candles. I call it Magnetic Wicks! This works really good, however the losses are very huge. During the holidays, I back tested with 5 years of data with different stop loss strategies and finally decided to go with a time wise stop strategy. If a trade has to win then it should be done within a certain number of candles. So, for different instruments the stop candle time is different. EURUSD 19 candles, GBPJPY 15 candles, GBPAUD 14 candles, USDCHF and NZDJPY 240 candles. However, still losses are bigger but not out of control. In the long run winners will compensate those losses and maybe turn my account green. Will see…
I’m still trading AUDNZD with my old H4 strategy.
2021 - Week#1
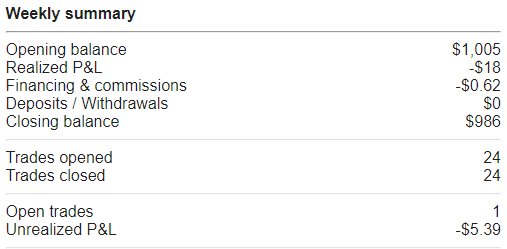
Not a bad first week of the year. Only lost some. Did some coding mistakes in the beginning but was able to fix them quickly.
This was a short week for me because Monday was a holiday. Now I have under 100 to recover. I have one open trade going next week. Last week’s open trade was a loss. But it was recovered pretty soon.
Woo, woo woo! Second consecutive losing week. If I do technical analysis of my journey so far, I think I’m at support level and balance should bounce back. Or breakout . Will see…
Very useful thread, too little algo traders here. Are you using python or C to trade with them? Also what’s your explanation why good backtesting results failed to translated into profitable trading?
@ontario, I’m glad that you found this thread useful. I use Perl to build my Algos against Oanda API. Thank you for asking the question about backtesting.
The major difference between the backtest and live is the trading cost and data mismatch. Some missed trades because of slippage, api disconnect etc.
Below is the comparison between the Live and Back test of GBP_AUD for this month so far and you can clearly see the differences…
@LiamMillen, my strategy is based on the idea that when there are wicks left by the market, it will come back to fill them. Probability of filling wicks is very high based on the back test. I call it “Magnetic Wicks”! But when market turn the face, it end up in big losses. You can see my Live vs Back test above.
Below is one trade setup that was taken on 2021-02-12T15:30:04.359258291Z. I’m working on building my analytical tool so pardon the quality of the chart. But I hope you will get the idea.
The wicks presented in black text are passing parameters to the Algo. Algo analyses the size of the wicks and take decisions on the direction of a trade. For example, in the chart, bottom wicks are greater than the top wicks, so the direction of the trade will be short and vise versa. The orange line is the take profit line.
Exit is either hit the TP or exit after a certain number of candles. I explained this in this thread above.
Very useful insight, thank you. Looks like transaction costs do make a big difference!
Looking at the opening times on demo and live I see significant time disrepancies. Assuming that trades in the two tables were opened by the same signal how do you explain the difference in opening times, like 2.86 sec. in the first trade?
Five second time frame is the minimum time frame that I can get for back test. I enter or exit trade after candle close. So, in back test it’s 5 second after 30 mins but in live whenever the 30 min candle is available.
Don’t want you to influence on your road to success, but why don’t you put a simple rules as “if the price is above the MA, don’t open short trades” or don’t open trades when it’s not trending or opposite (using the ADX to determine if it’s trending or not). This way you are filtering some trades which are doomed to fail.
At least that’s how up to me you should proceed - to improve the odds of opening the trades in your favour. You can back test, and if the results are improving, then keep them, if they don’t then study the trades and see the conditions when they fail, so put some restrictions when the conditions are not met.


 It was just a matter of time my account started going down and I was of the impression it will come back only to realize it is going down more. Hence revisited strategy and started looking for risk management. Put some risk management strategies and got it under control. However, it was under control but wasn’t recovering.