2021 - Week#3
This was a short week for me because Monday was a holiday. Now I have under 100 to recover. I have one open trade going next week. Last week’s open trade was a loss. But it was recovered pretty soon.

Journey so far:
2021 - Week#3
This was a short week for me because Monday was a holiday. Now I have under 100 to recover. I have one open trade going next week. Last week’s open trade was a loss. But it was recovered pretty soon.
Journey so far:
2021 - Week#4
What a rough week for me! Losses came one after another resulting in a RED first month of 2021. But this is part of the game. 
Journey so far:
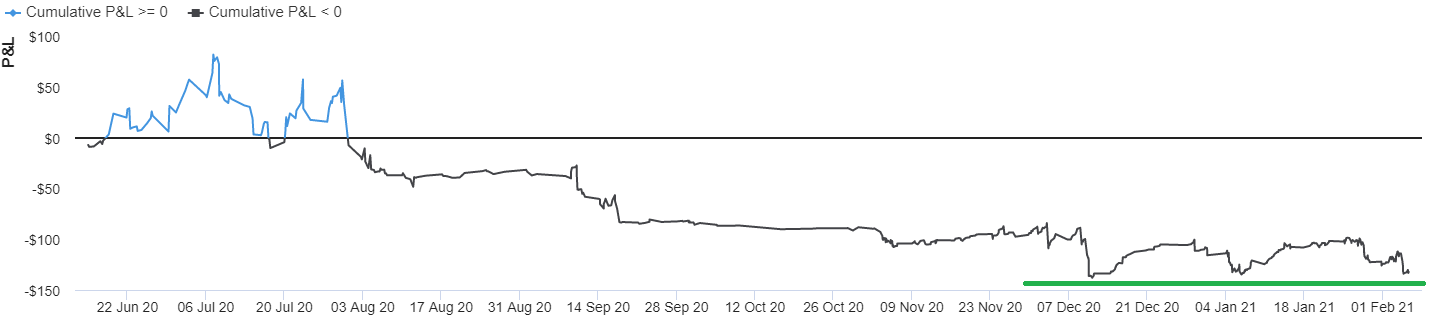
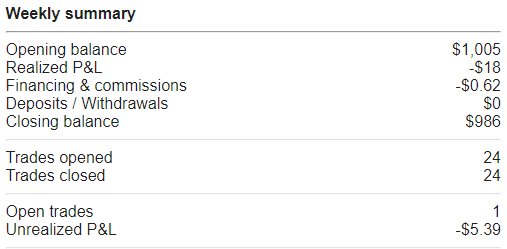
2021 - Week#5
Woo, woo woo! Second consecutive losing week. If I do technical analysis of my journey so far, I think I’m at support level and balance should bounce back. Or breakout . Will see…
Journey so far:
2021 - Week#6
This week was a breakeven week. Lost trades in the beginning of the week and then the rest of the week was in the recovery phase.
In my journey so far I’m still at support level!
Journey so far:
Very useful thread, too little algo traders here. Are you using python or C to trade with them? Also what’s your explanation why good backtesting results failed to translated into profitable trading?
I am also looking forward to getting the strategy updated. I think it will help a lot.
@ontario, I’m glad that you found this thread useful. I use Perl to build my Algos against Oanda API. Thank you for asking the question about backtesting.
The major difference between the backtest and live is the trading cost and data mismatch. Some missed trades because of slippage, api disconnect etc.
Below is the comparison between the Live and Back test of GBP_AUD for this month so far and you can clearly see the differences…
@LiamMillen, my strategy is based on the idea that when there are wicks left by the market, it will come back to fill them. Probability of filling wicks is very high based on the back test. I call it “Magnetic Wicks”! But when market turn the face, it end up in big losses. You can see my Live vs Back test above.
Below is one trade setup that was taken on 2021-02-12T15:30:04.359258291Z. I’m working on building my analytical tool so pardon the quality of the chart. But I hope you will get the idea.
The wicks presented in black text are passing parameters to the Algo. Algo analyses the size of the wicks and take decisions on the direction of a trade. For example, in the chart, bottom wicks are greater than the top wicks, so the direction of the trade will be short and vise versa. The orange line is the take profit line.
Exit is either hit the TP or exit after a certain number of candles. I explained this in this thread above.
2021 - Week#7
Everything was going well until thursday. On Thursday a couple of big losses and my journey broke the support level. Will see if it will recover…
Journey so far:
Very useful insight, thank you. Looks like transaction costs do make a big difference!
Looking at the opening times on demo and live I see significant time disrepancies. Assuming that trades in the two tables were opened by the same signal how do you explain the difference in opening times, like 2.86 sec. in the first trade?
Five second time frame is the minimum time frame that I can get for back test. I enter or exit trade after candle close. So, in back test it’s 5 second after 30 mins but in live whenever the 30 min candle is available.
Don’t want you to influence on your road to success, but why don’t you put a simple rules as “if the price is above the MA, don’t open short trades” or don’t open trades when it’s not trending or opposite (using the ADX to determine if it’s trending or not). This way you are filtering some trades which are doomed to fail.
At least that’s how up to me you should proceed - to improve the odds of opening the trades in your favour. You can back test, and if the results are improving, then keep them, if they don’t then study the trades and see the conditions when they fail, so put some restrictions when the conditions are not met.
@nchankov, Thank you for your advice! Trading is a lonely business and these kind of advices and questions helps. I haven’t tried ADX because I don’t know what it does. Maybe I’ll study about that and back test.
Any indicator is lagging, as it’s generated mainly from the previous aggregated prices, but you can apply it on a higher timeframe e.g. if you trade on 30min then apply it on 4h or a daily chart and so on.
ADX is not very reliable as 100% it’s trending or not, but well which one is
2021 - Week#8
Second month of the year! It means, 2 months of consistently following the same strategy and trading plan irrespective of losses. Will see how long this will continue.
This week I recovered little from last week’s losses. I still have 3 trades open which are down so far. Will see how they will end next week…
Monthly:
Weekly:
Journey so far:
2021 - Week#9
My account didn’t even touch 0 line this week. So the fight is still on
Weekly:
Journey so far:
2021 - Week#10
At least this week was positive. However, I have 3 open trades which are in a deep hole. Will see how they will end next week.
Weekly:
Journey so far:
2021 - Week#11
Out of the 3 last week’s trade one ended in gain rest two in loss. One trade went over my 1 week threshold because of a coding mistake. Nowadays I’m analyzing my old trades for each pair and trying to find blind spots or a way to improve. Especially for big big losses. Will see if I change something based on this analysis.
This week:
Journey so far:
2021 - Week#12
Some more dips this week. I have been analyzing old trades and the pattern matches with my back test. So if I continue to trade this way, in 2 to 3 yrs I’ll be green. But I want to get rich soon . I have higher win rates. So if I increase units here and there may cover my big losses. I haven’t decided yet to increase units but I’m trying to find out any pattern/setup when odds are in my favor. Will see if I’ll go with that.
This week:
Journey so far:
2021 - Week#13
What a first quarter of the year! All down! I have been analyzing my trades for a while now and came to the conclusion that either I completely change my strategy or tweak the current strategy. I went for the later one. I’ll be trading my same strategy of analyzing 10 candles and trade towards the direction of higher wicks. However, now I have coded to dynamically position size. What it means is, under certain scenarios only trade bare minimum (100) units. But when conditions are favorable go for the max (2% of account). Back test has shown that there are chances of big losses even in favorable condition. But the probability of happening that is low and if I stick with this plan, maybe things will turn around. Will see if I’ll stick to the plan
Journey so far: