Hello fellow traders. In this technical article we’re going to take a quick look at the Elliott Wave charts of Amazon stock. We have been calling for the rally in the stock due to impulsive bullish sequences in the cycles from the June lows. Consequently, we recommended members to avoid selling the stock, while keep favoring the long side in near term. In the further text we are going to explain the Elliott Wave Forecast.
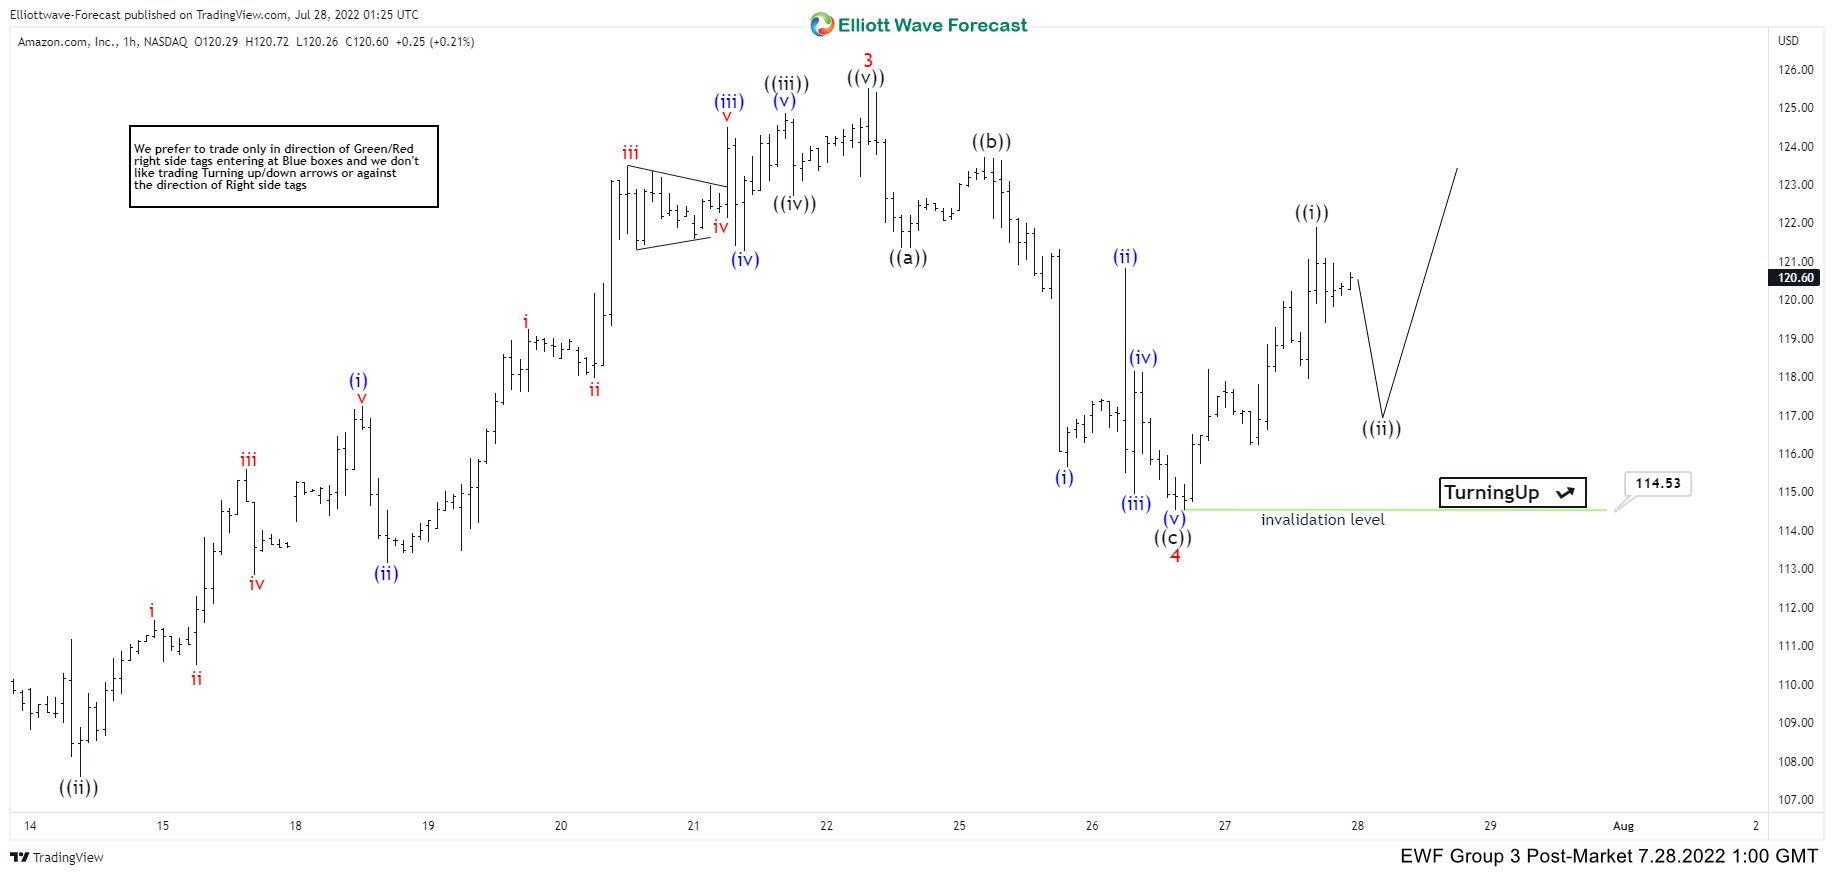
Amazon Elliott Wave 1 Hour Chart 07.28.2022
We assume that cycle from the 06/30 low is unfolding as 5 waves structure. Wave 4 red ended at 114.53 low. As far as the price holds above that level we expect to see further rally toward new highs targeting at least 127.9-132.1 area. 15 min cycle from the 114.53 low looks completed as 5 waves structure. We expect to see 3 waves pull back in ((ii)) before rally takes place toward new highs
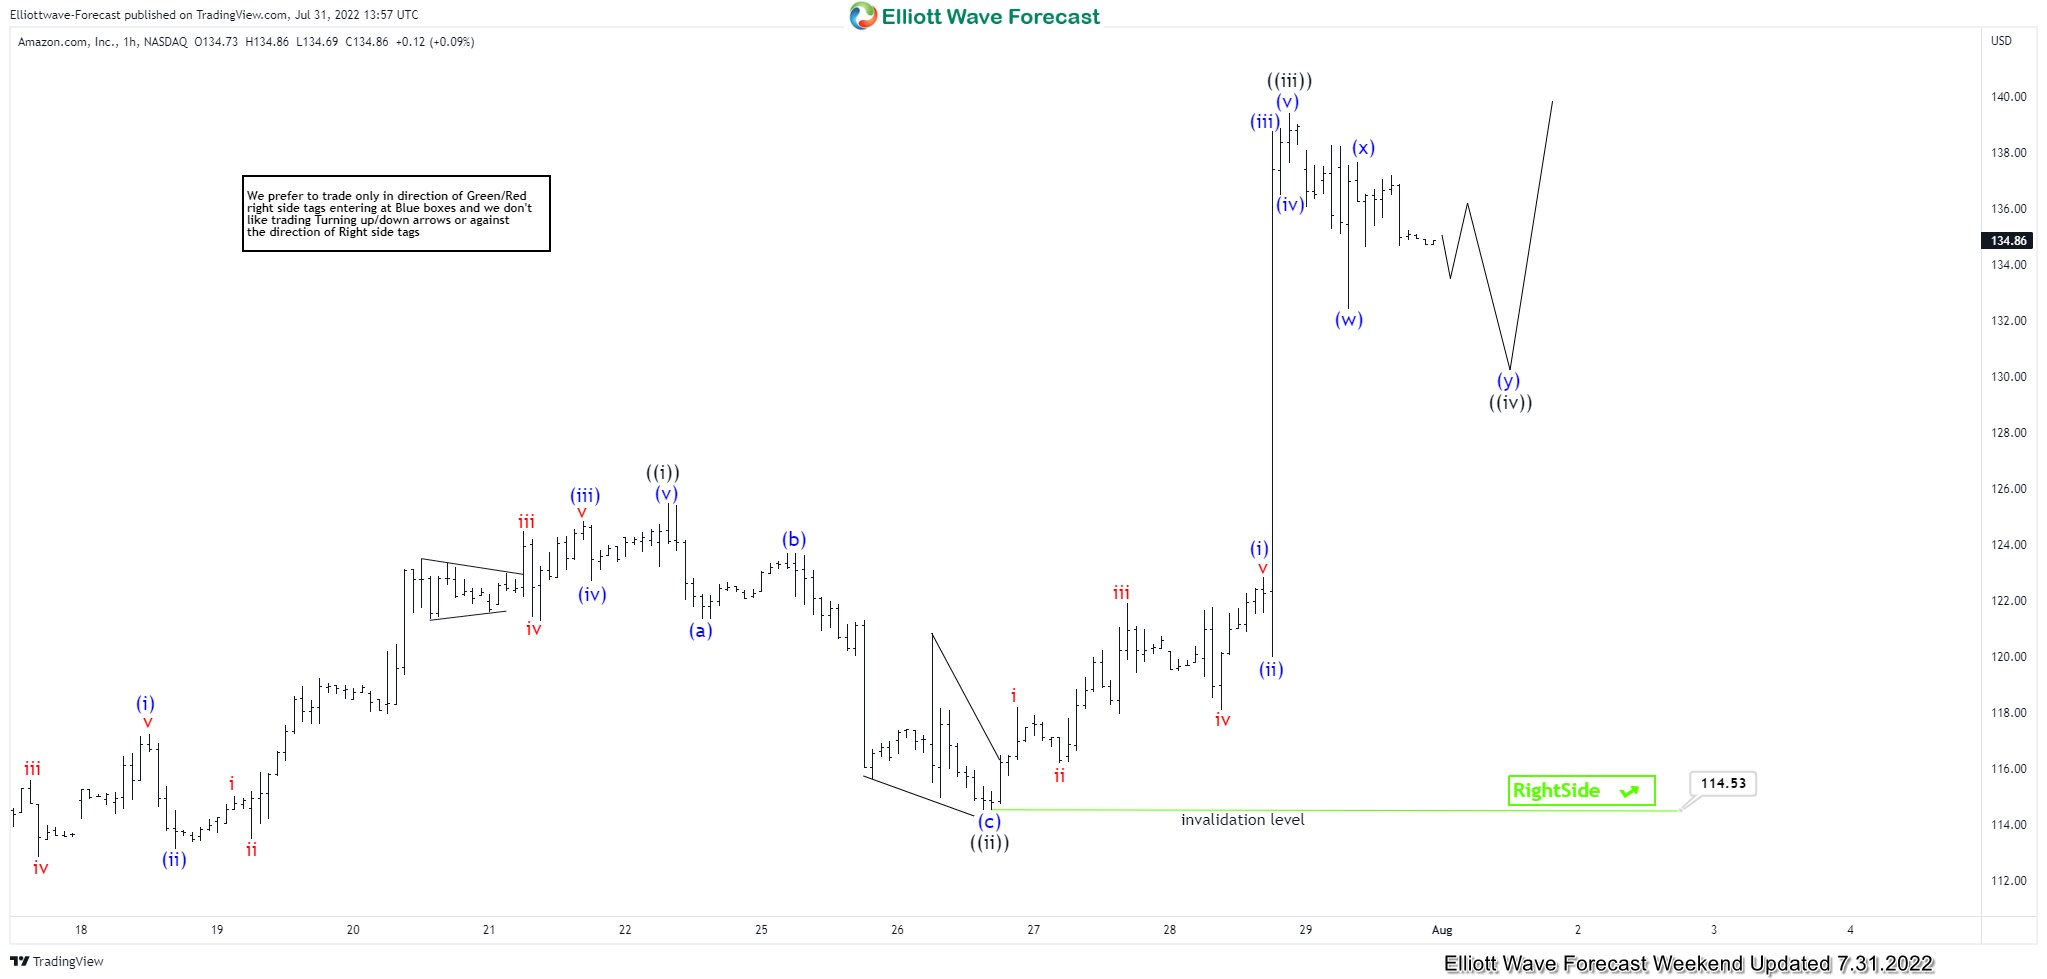
Amazon Elliott Wave 1 Hour Chart 07.31.2022
114.53 low held nicely during the short term pull back and we got rally toward new highs as expected. Rally from the 114.53 was strong and RSI divergency got erased so we believe we are still within wave 3 red instead of doing 5 red as labeled on previous chart. Currently doing ((iv)) pull back which is correcting the cycle from the 114.53 low. While below last short term high (x) blue, we can be doing (y) of ((iv)) toward 130.9-126.7 . At that area buyers should ideally appear for further rally toward new highs.
Keep in mind that market is dynamic and presented view could have changed in the mean time. You can check most recent charts in the membership area of the site. Best instruments to trade are those having incomplete bullish or bearish swings sequences. We put them in Sequence Report and best among them are shown in the Live Trading Room
Elliott Wave Forecast
Source: Amazon (AMZN) Elliott Wave : Impuslive Sequences Calling The Rally