In this technical blog, we are going to take a look at the past performance of Elliott Wave Charts AMD. We presented to members at elliottwave-forecast. In which, the rally from 12 March 2020 low ( $36.25) unfolded as a 5 wave leading diagonal structure with the sub-division of (3-3-3-3-3) structure in each leg. Thus suggested that it’s a continuation pattern. And as per Elliott wave theory after a 3 waves pullback, it should do another extension higher in 5 waves impulse structure at least. Therefore, we advised members not to sell the instrument & trade the no enemy areas ( blue boxes) as per Elliott wave hedging remained the preferred path looking for 3 wave reaction higher at least. We will explain the structure & forecast below:
AMD 4 Hour Elliott Wave Chart From 6.28.2020
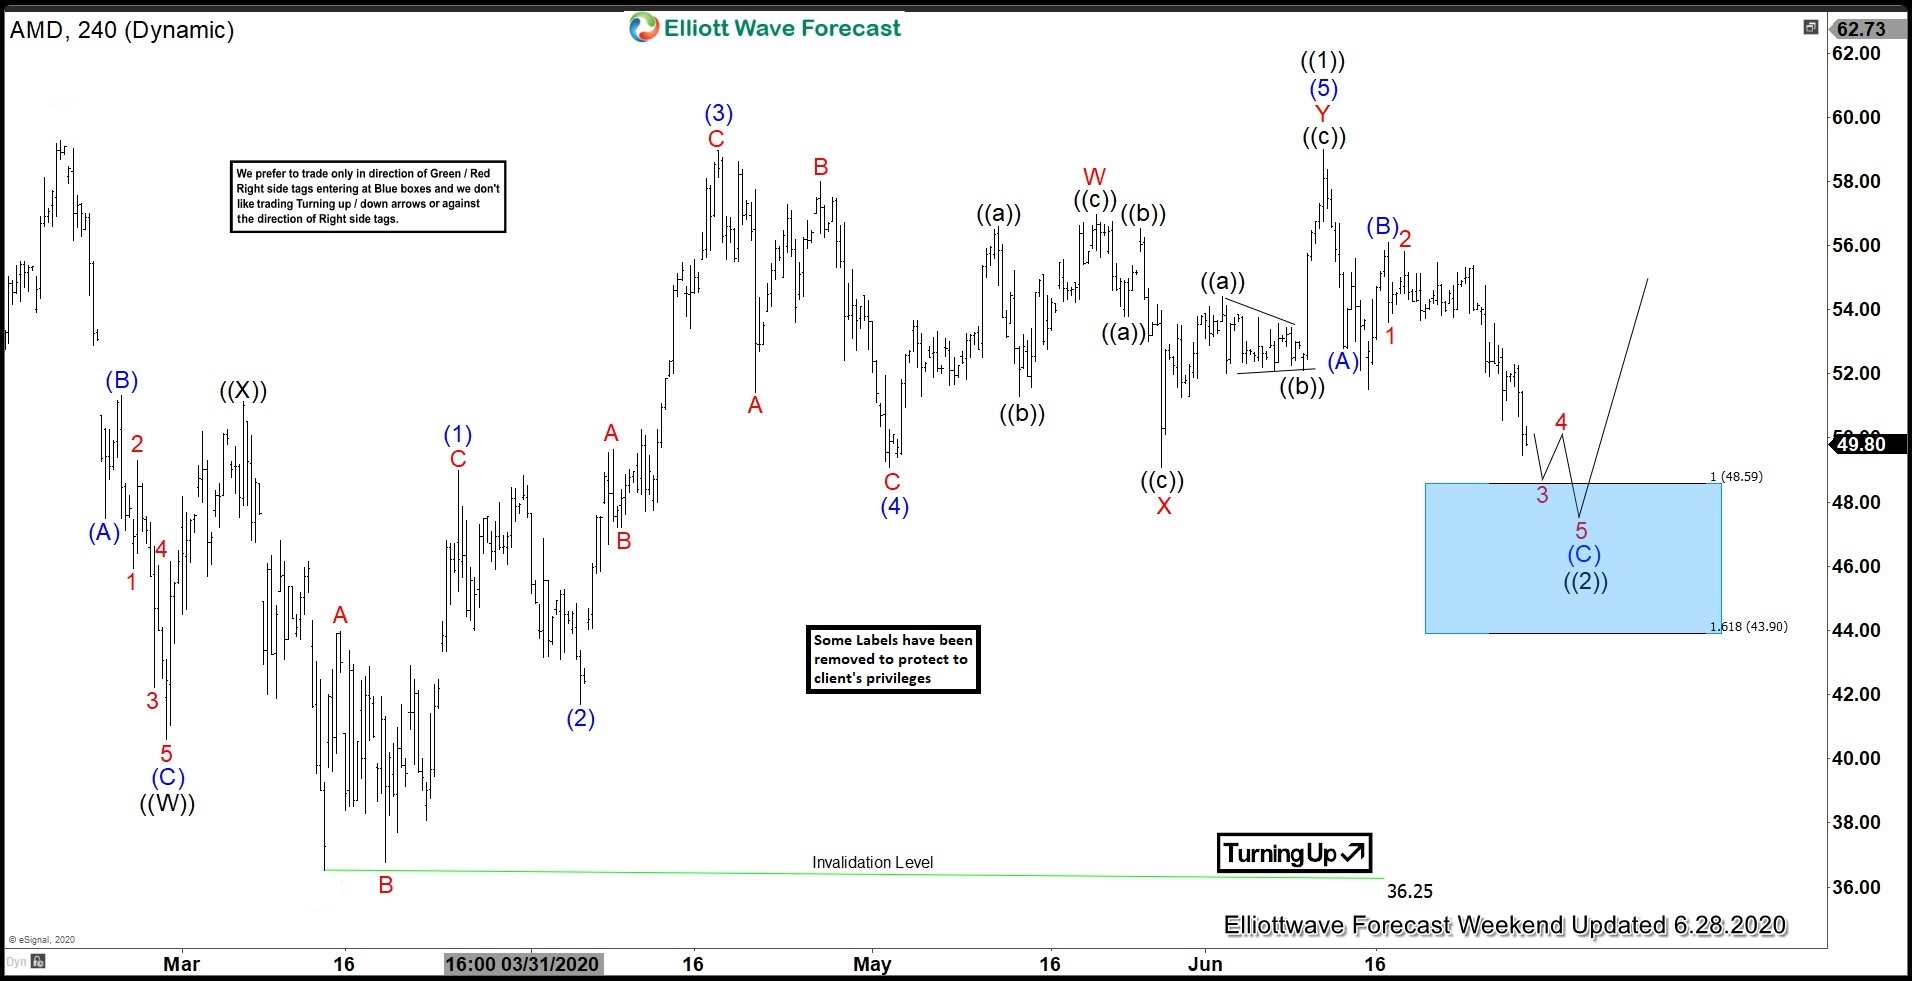
Above is the 4 Hour Elliott Wave Chart of AMD stock from 6/28/2020 Weekend update. In which, the rally from 12 March 2020 low unfolded as 5 waves sequence where wave (1) ended at $48.99 high. Wave (2) ended at $41.70 low, wave (3) ended at $58.95 high, wave (4) ended at $49.09 low. While wave (5) ended at $59 high which ended a bigger degree wave ((1)). Down from there, the stock made a 3 wave pullback to correct the cycle from 3/12/2020 low within wave ((2)). The internals of that pullback unfolded as a zigzag structure where wave (A) ended at $52.80 low. Wave (B) bounce ended at $56.10 high and wave © was expected to reach $48.59- $43.90 blue box area. From there, buyers were expected to appear in the stock looking for another 5 waves rally. Or to do a 3 wave reaction higher at least.
AMD 4 Hour Elliott Wave Chart From 7.02.2020
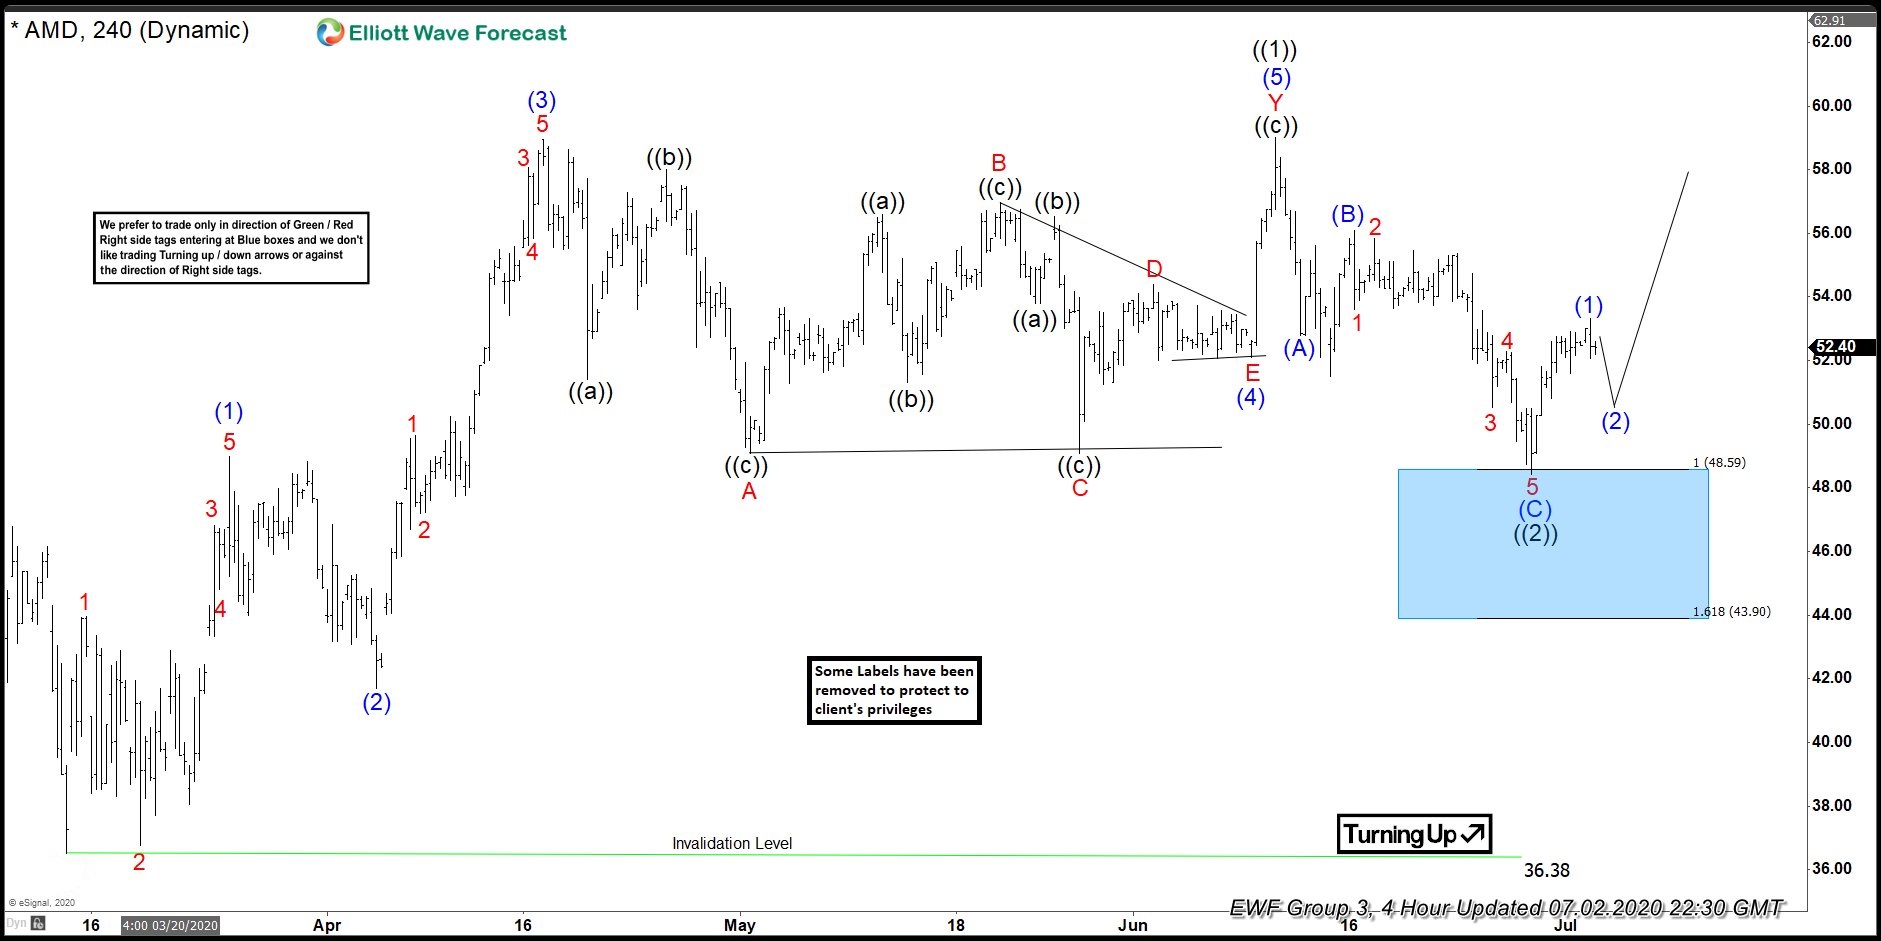
Here’s 4 Hour Elliott Wave Chart of AMD from 7/02/2020 update. In which the stock is showing reaction higher taking place from the blue box area. Allowed members to create a risk-free position shortly after taking the longs at $48.59- $43.90 blue box area. However, a clear break above 6/20/2020 prior wave (5) of ((1)) peak ($59) still needed to confirm the next extension higher & avoid double correction lower.