In this technical blog, we are going to take a look at the past performance of 1 hour Elliott Wave Charts of Advance Micro Devices ticker symbol: AMD. In which, the rally from 02 November 2020 lows, showed the higher high sequence in an impulse structure favored more strength to take place. Also, the right side tag pointed higher & favored more strength. Therefore, we advised our members to buy the dips in AMD in 3, 7, or 11 swings at the blue box areas. We will explain the structure & forecast below:
AMD 1 Hour Elliott Wave Chart
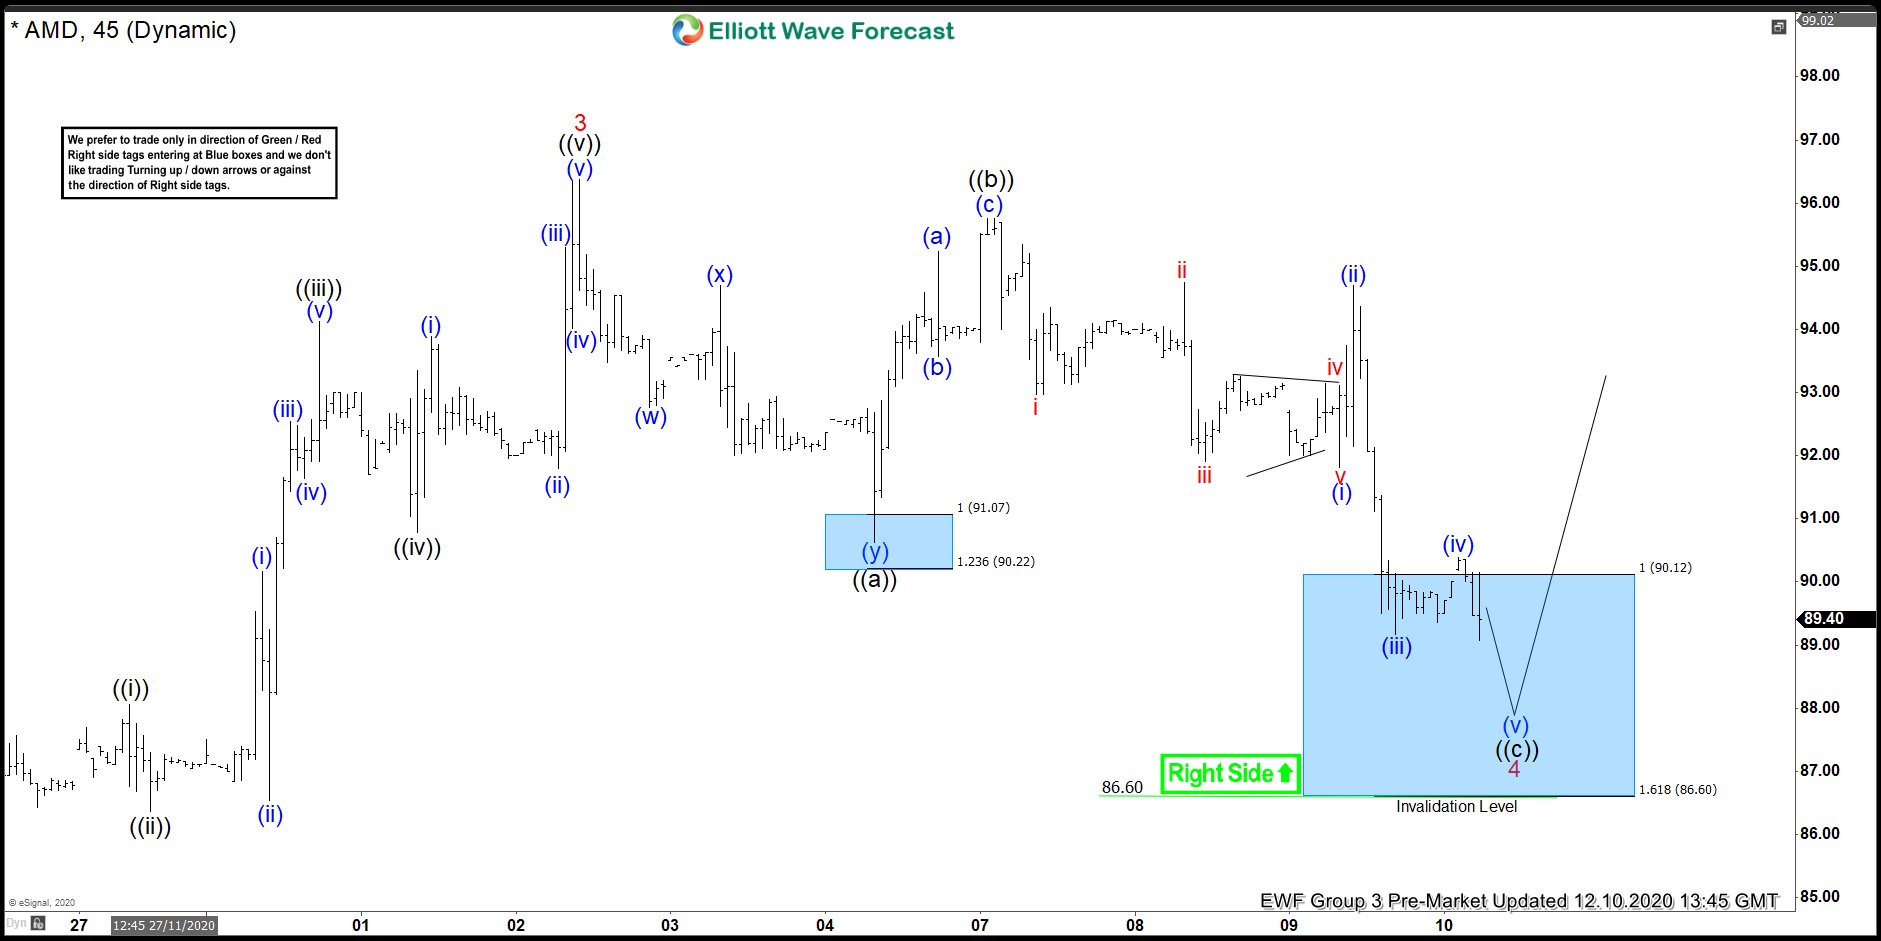
Above is the 1 hour Elliott Wave chart of AMD from the 12/10/2020 Pre-Market update. In which, the rally from 11/11/2020 low unfolded as an impulse sequence & ended wave 3 at $96.37 high. Down from there, the stock made a 3 swings pullback to correct that cycle in wave 4. The internals of that pullback unfolded as Elliott wave flat structure where wave ((a)) ended at $90.63 low. Wave ((b)) bounce ended at $95.75 high. Below from there, wave (©) unfolded as 5 wave structure & managed to reach the 100%-161.8% Fibonacci extension area of ((a))-((b)) at $90.12-$86.60 blue box area. From where buyers were expected to appear looking for more upside or for a 3 wave bounce at least.
AMD 1 Hour Elliott Wave Chart
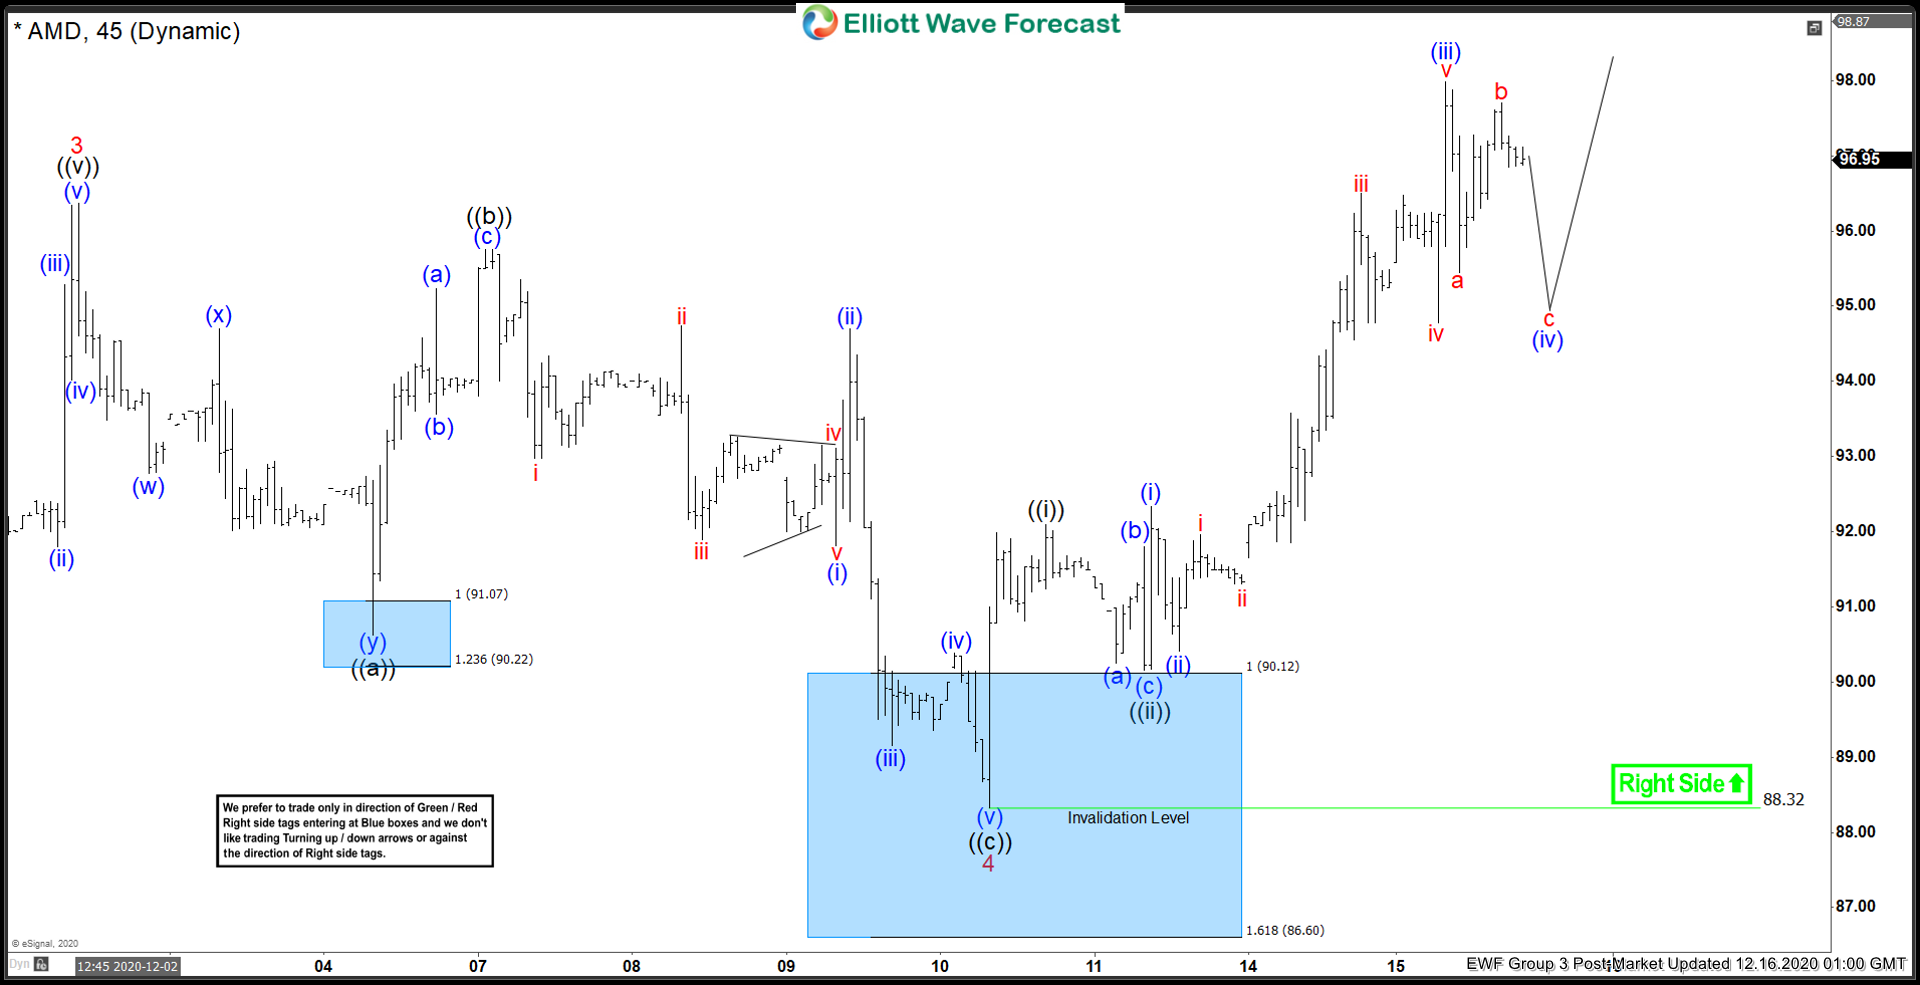
Here’s the latest 1 hour Elliott Wave Chart of AMD from 12/16/2020 Post-Market update. Showing a strong reaction higher from the blue box area. Allowed longs to get into a risk-free position shortly after the long positions at $90.12-$86.60 blue box area.