American Express Company (Amex), symbol AXP, is an American multinational financial services corporation that specializes in payment cards. Headquartered in New York City, it is one of the most valuable companies in the world and one of the 30 components of the Dow Jones Industrial Average.
AXP Weekly Chart August 2023
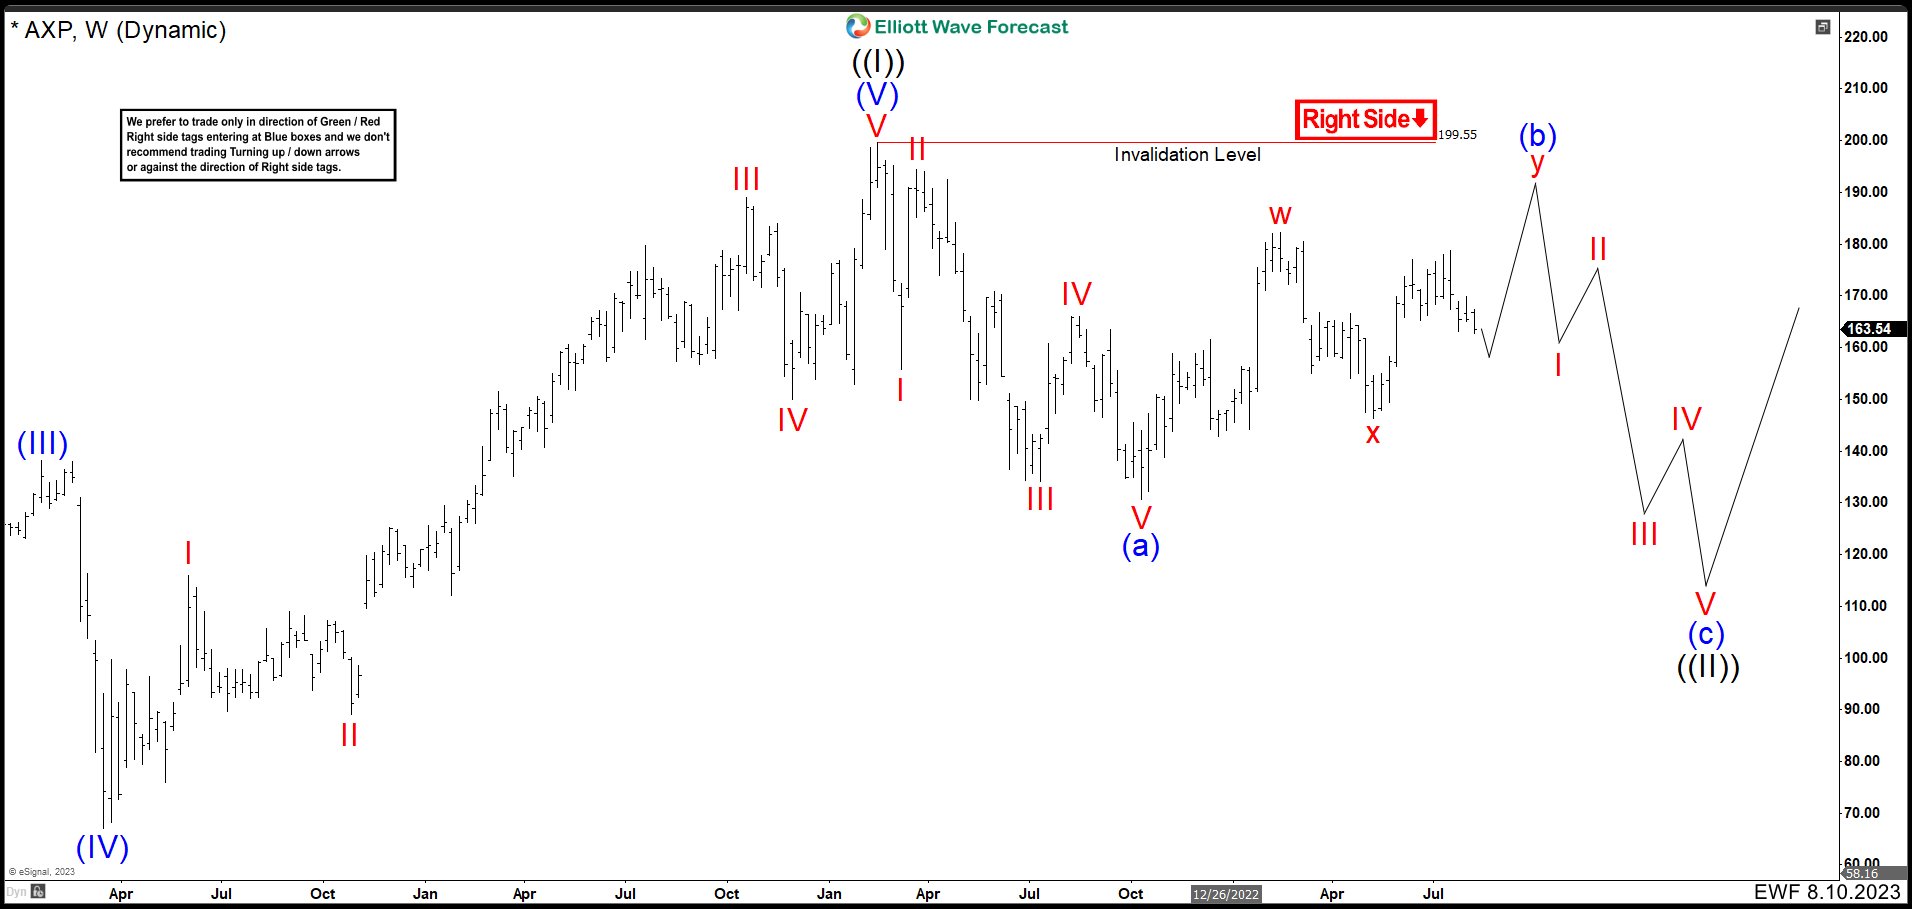
We believe that the AXP ended a Great Super Cycle at the peak of 199.55 which we call wave ((I)). The stock started a bearish structure (a), (b), and (c). Wave (a) built a leading diagonal. The first fall reached 155.72 ending wave I. The market bounded strongly ending wave II at 194.35 and then continued with a bearish movement. We can see from wave II a clear impulse lower to complete wave III at 134.12. Then the wave IV correction ended at 166.06, within the wave I zone thus creating the leading diagonal. Finally, the last leg towards 130.65 ended wave V and wave (a) in October 2022 low. The market bounced beginning a wave (b) correction. We called a double correction w, x, y Elliott structure given the market conditions in that moment.
AXP Weekly Chart December 2023
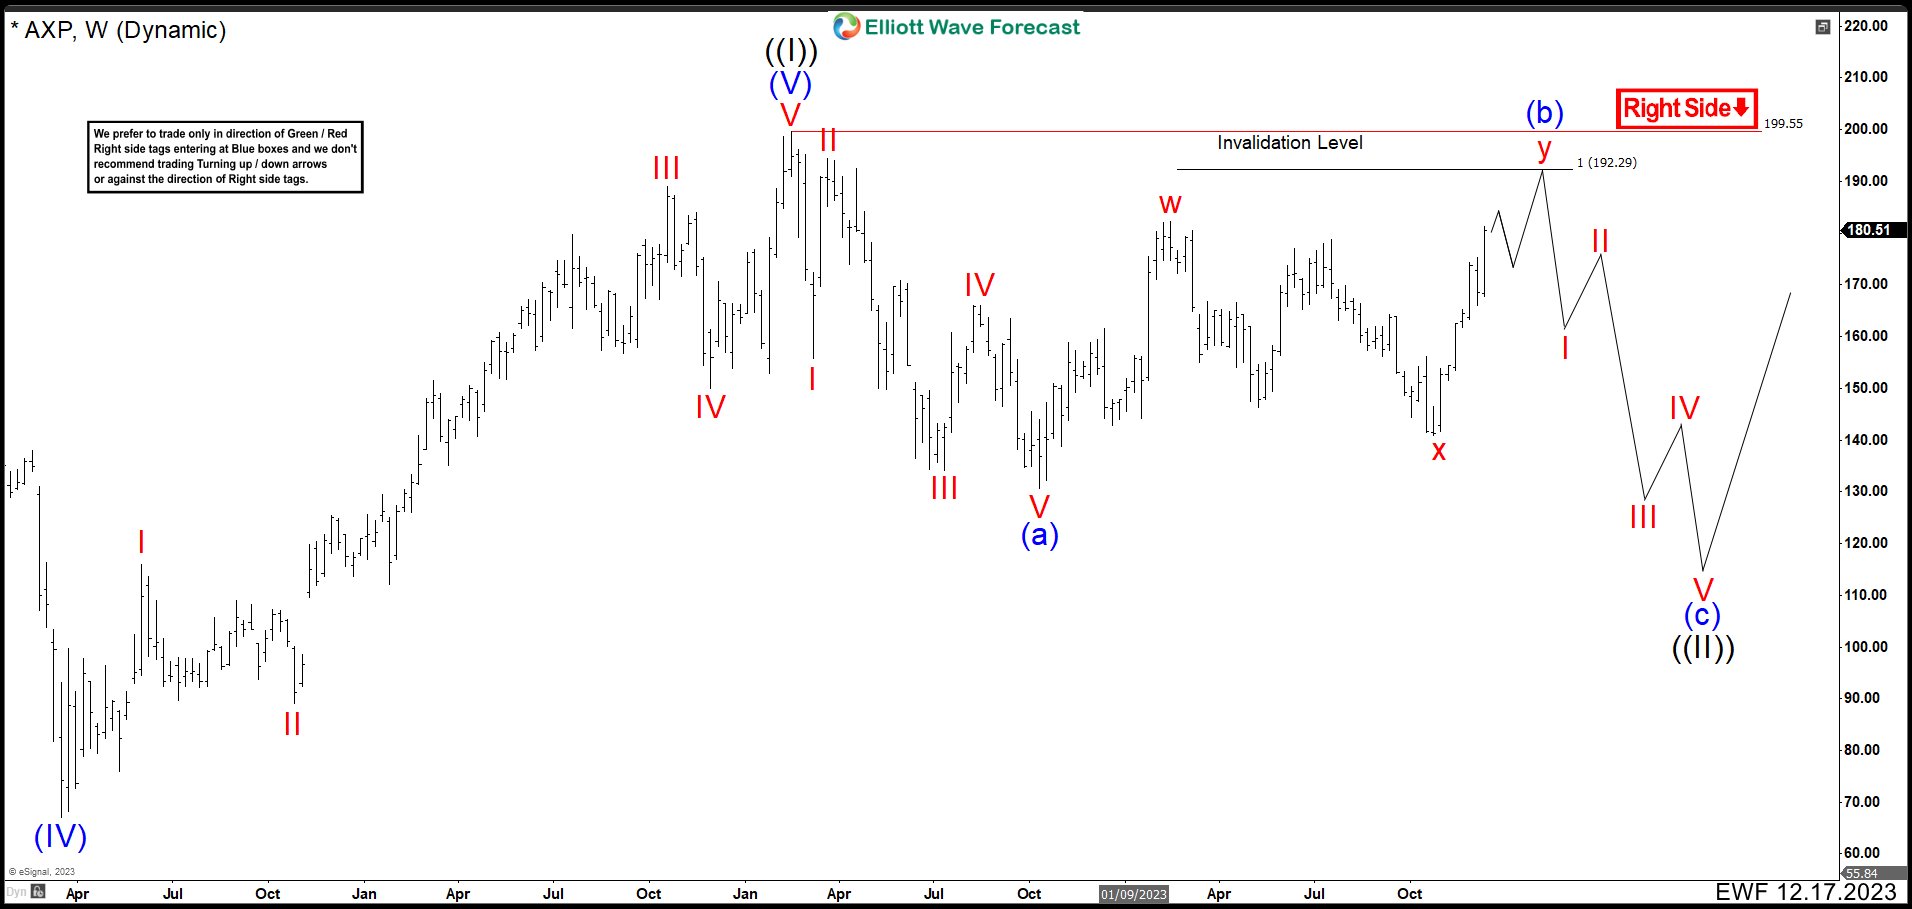
Up from October 2023 low, we can see clearly 3 swings higher ending wave w at 182.15. Then 3 swings lower ended wave x connector at 140.91 hitting 100% Fibonacci extension. Currently, AXP is trading in wave y of (b). The equal legs extension from waves w and x comes in 192.29. Therefore, the area we could look for selling opportunities is 192.92 - 199.55 (invalidation level). We must see a reaction lower in the zone to think that wave (b) is finished because we cannot rule out a flat correction as wave ((II)). In that case, wave (b) could break slightly higher above 199.55 before resuming lower in wave (c). Once wave (b) is done, we can calculate the ideal area to end wave (c) of ((II)) as target.