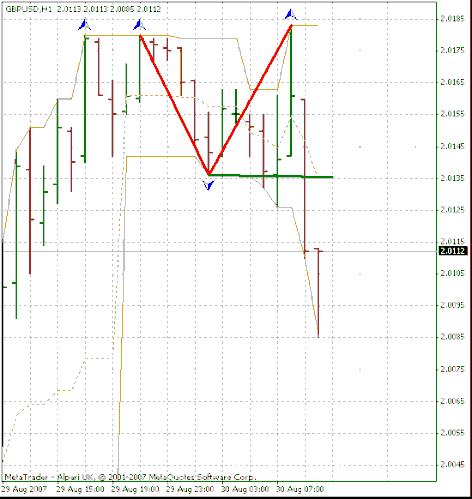
well i guess you can not short when you have the zigzag break, as it rebounce the price, i am still not so good in this zigzag break strategy, but it is really an interesting tools as it makes the price bounce most of the time, and rare case the price reverse totally
i know the divergence strategy, but didnt know that it works on the BB squeeze as well, as i use it with the stochastic, MACD or OSMA
well this is another signal to add to your main strategy to watch the highest high of the hsitogram
well as i can see, your trade were in a profit before it bounced, u should have sold half your position on the zigzag correction signal.
[U]by the way :[/U] what is that lighting box in the top right, it doesnt change in my chart, any idea how to fix it in order to make it work??
Good to see you made +pips today. Looks like my trade whipped me out then went back down, and the second break would be good for 50 or at least a BE.
Yes the squeeze it great for divergence, I miss most of them for some reason dont see them tell after there im play. dont run thru the charts fast enough I guess.
the way to use the zigzag the safest is to trade the 123 pattern off of it, not just a break of it. If there is a strong trend then its normmaly a good trade to take a break of the fractal either way.
the top right corner is a nice little indicator that gives you the strength of several indicators as well as the current price and range info.
#Signal_Bars_v6.zip (47.2 KB)
thks man, it works now the price box, just a question, if on a frame like H1 , all signals r green, it means there is an uptrend?
thks
can u just post me a snapshot of the chart with the zigzag 123 pattern and what do u mean the break of the fractal?
yes the more bars green the stronger the move.
Here is todays trade on cable its a bolli entry. +40 coulda been 50
Ill post a 123 trade for you in a minute.
here is the fractal or 123 trade inside the blue box you see 1 in the upper left corner of chart, then a low point which is lableled 2, and 3 which is a lower high then number 1. This must be a lower high by the rules.
Then you would take the break of the point 2.
Basic target is the recent high or #3 and target should be the number of pips between 2 and 3.
Ive done this on demo on 5 min charts but not very succesful I prefer 15 min and up for live trades.

You can also use the fractal indicator that MT4 has in the standard indicators.
It simply draws a fractal if there are two bars on either side of the fractal that are lower for a high fractal and higher for a low fractal.
the 123 is your basic break of support or resistance trade.
cool i went long on gu after the first closing green bar at 2.00070 , good trade
by the way i can see u have some red dots on a blue line in the charts, plus how to overlap a MACD in the bb squeeze down there? as i openedon eMACD alone in a separate window but that makes the charts small
I was trying to find a support and resistance indicator I like.
I like the one with the aqua and yellow lines the best but getting to many indicators on the chart.
Not sure how to put the squeeze and emacd together unless you can drag and drop the emacd from the navigator right on top of the squeeze, or you many have to do it the opposite.
Support & Resistance.zip (686 Bytes)
i have 3 indicators, but every time i want to upload them it is saying invalid file, but u can get them from the mt4 indicator site,
You need to put them into a zip file before babypips will let you upload them.
when you browse to find the file just left click on it and you should get a list of opportunities and one should be to archive that will put it in a zip file.
You mentioned yahoo, mine is sparkyshulk
[QUOTE=droesparky;19888]You need to put them into a zip file before babypips will let you upload them.
when you browse to find the file just left click on it and you should get a list of opportunities and one should be to archive that will put it in a zip file.[/QUOTE]
well let me see, i attach some indicators ust check them
Is the stopreversal indicator fairly relieable? will it move once its put on the chart.
Here is the trade I missed today. Neg divergence on the chart shows very plain. I saw it but with yesterdays strong move I stayed out. Note to self. (You should always trade your plan.)
There was also a nice 123 trade.
nice 2 see that,i think is a good stuff,but i be glad if anybody can help with i hr strategies.keep the good work.


