Hello everyone. In today’s article, we will look at the past performance of the 1H Hour Elliott Wave chart of Apple Inc ($AAPL). The rally from 12.11.2023 low at $191.42 unfolded as 5 waves. So, we expected the pullback to unfold in 3 swings and find buyers at 195.31 - 193.16. We will explain the structure & forecast below:
$AAPL 1H Elliott Wave Chart 12.17.2023:
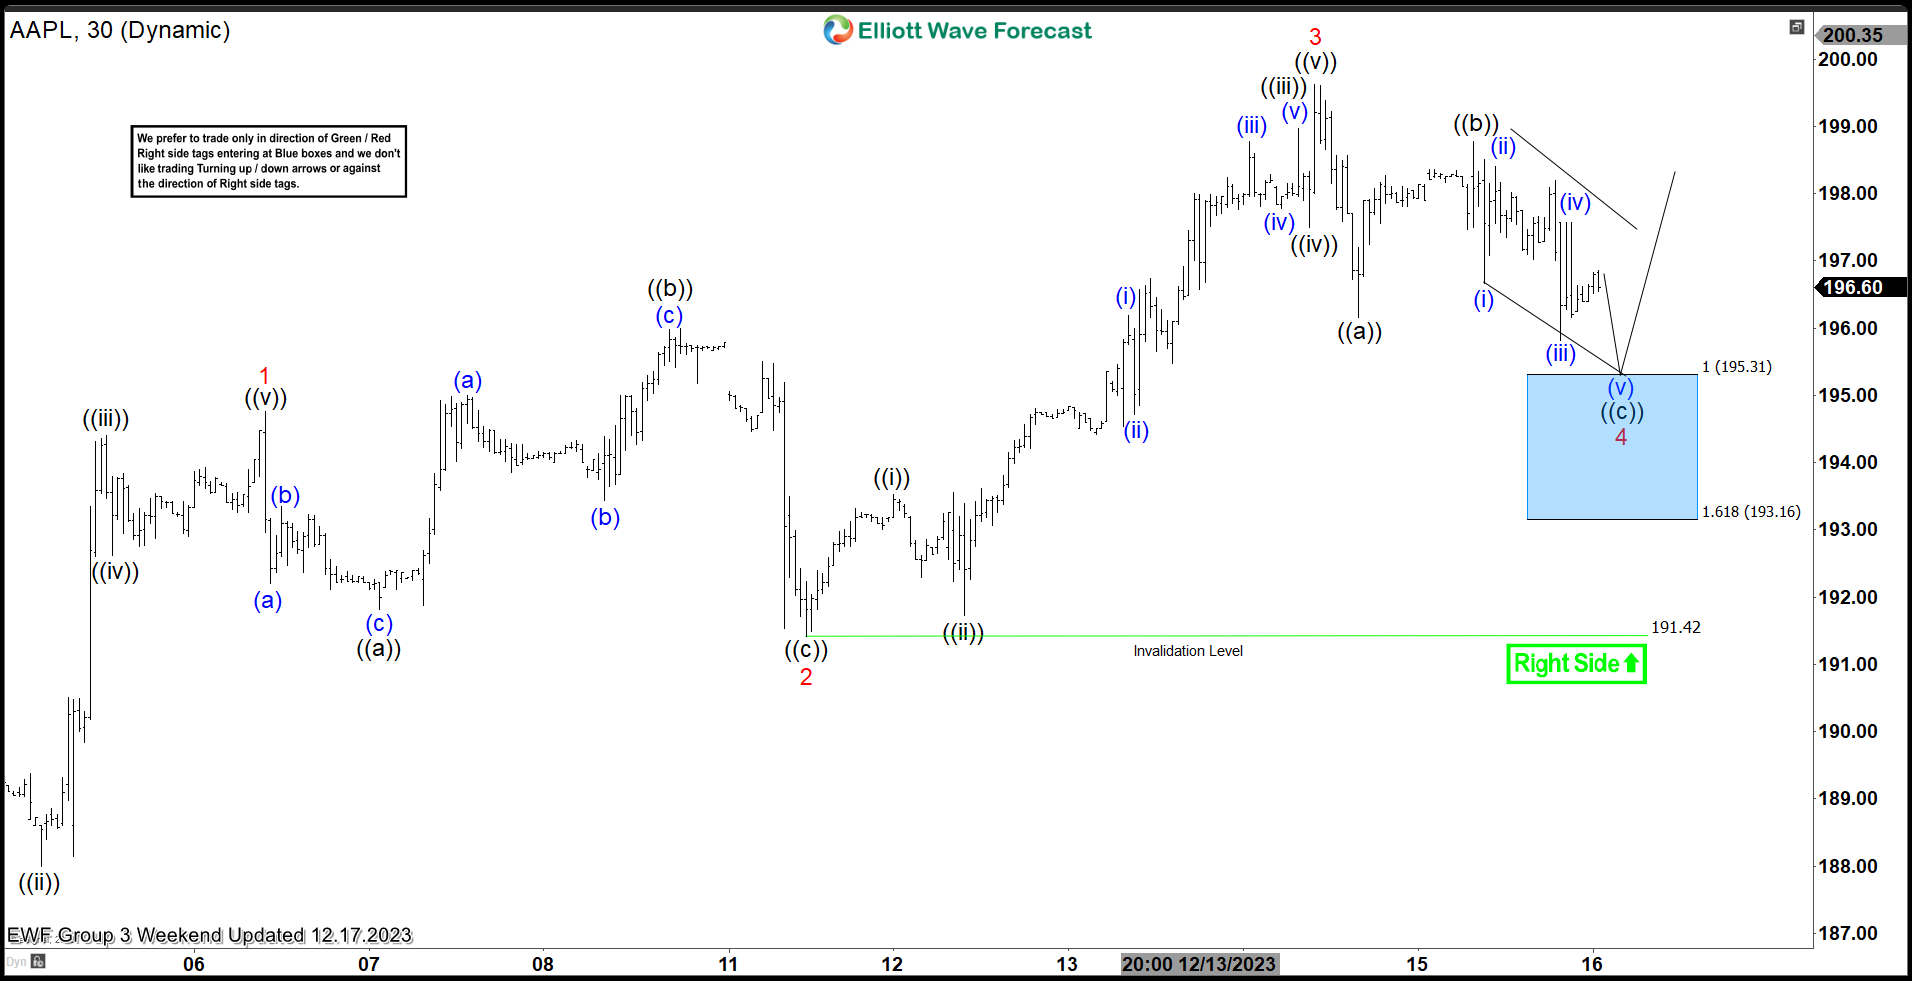 Here is the 1H Elliott Wave count from 12.17.2023. We expected the pullback to find buyers from the blue box area at red 4 in a 3 swing structure (ABC) at 195.31 - 193.16.
$AAPL 1H Elliott Wave Chart 12.20.2023:
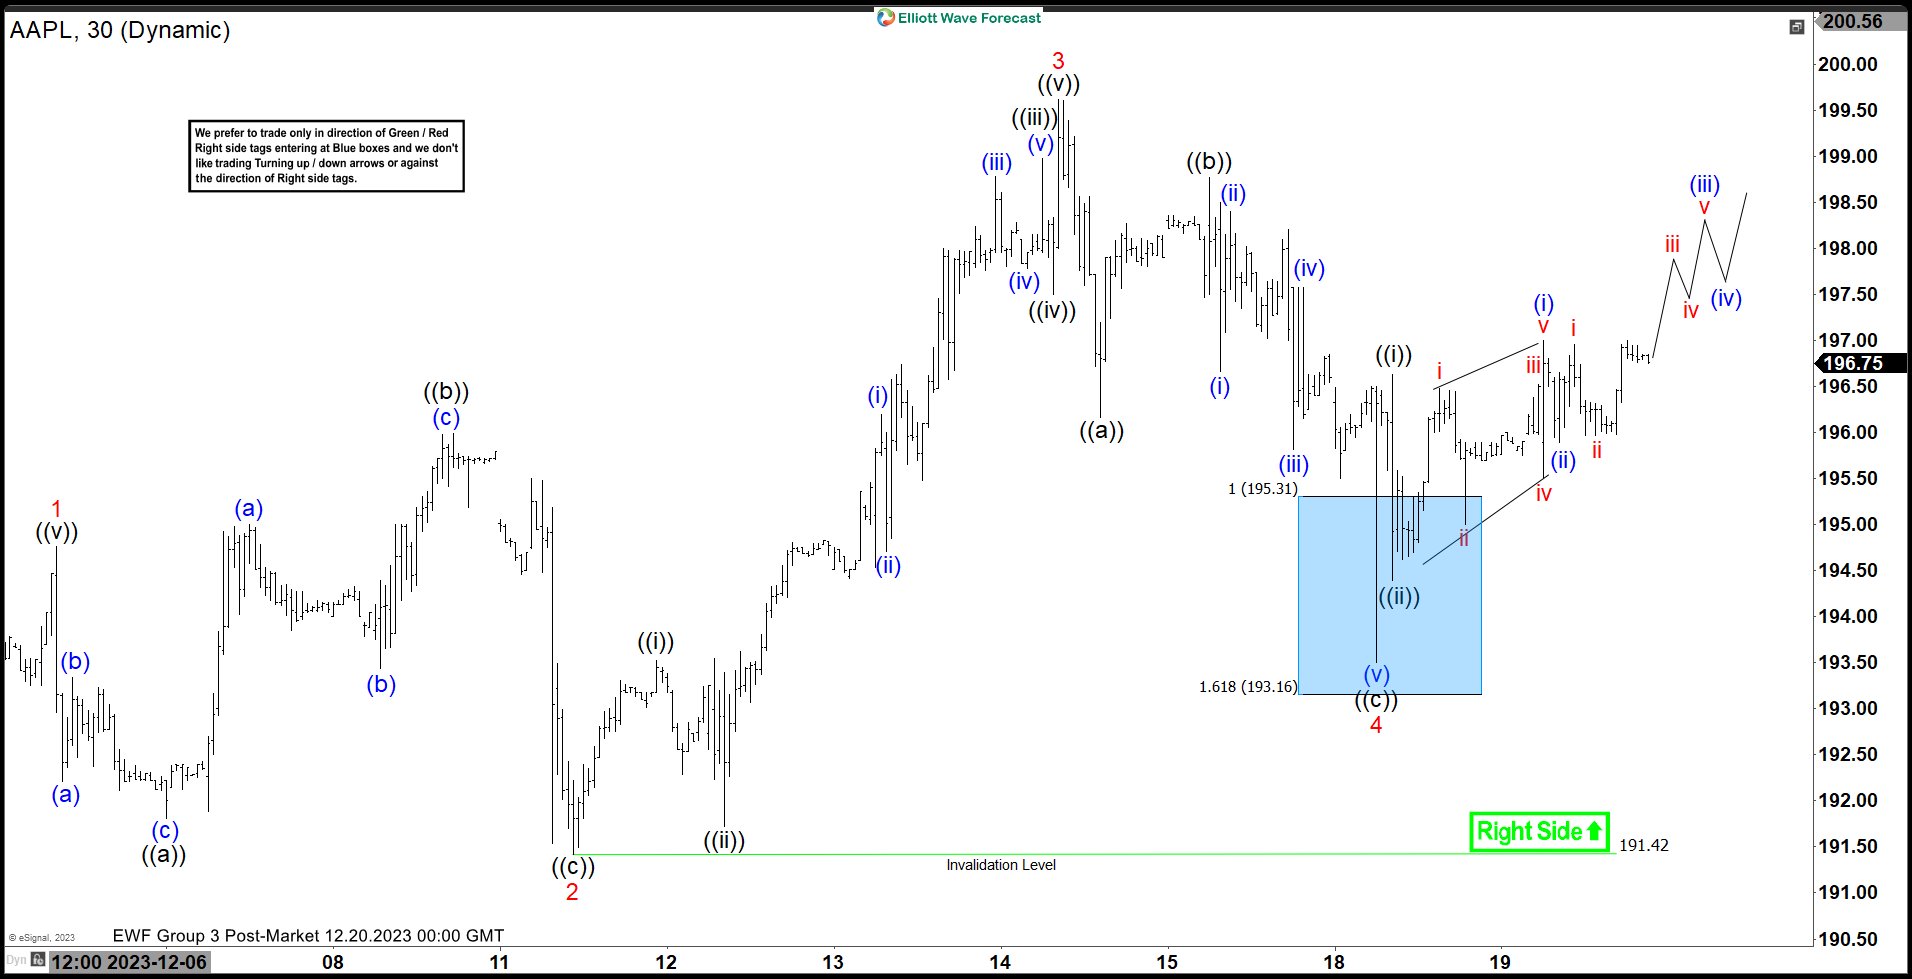 Here is the 1H update few days later, showing the bounce taking place as expected. The stock reacted higher after reaching the blue box area.