ASML Holding N.V. (ticker: ASML) is a leading Dutch semiconductor equipment manufacturer. It’s one of the world’s largest suppliers of lithography systems for the semiconductor industry. Established in 1984, ASML has played a crucial role in the advancement of chip-making technology. Its advanced lithography machines enable the production of smaller, faster, and more powerful microchips used in various applications, including smartphones, data centers, artificial intelligence, and autonomous vehicles.
ASML’s lithography systems employ a technology called Extreme Ultraviolet (EUV) lithography. This allows for the creation of ultra-fine circuit patterns on silicon wafers. This technology is critical for semiconductor manufacturers to keep up with Moore’s Law. The Law states that the number of transistors on a chip doubles approximately every two years. This in turns drives the continuous progress of computing power.
The company operates globally, serving major semiconductor manufacturers worldwide. Its customer base includes industry giants such as Intel, Samsung, and TSMC. ASML’s technological leadership, strong intellectual property portfolio, and focus on research and development have positioned it as a key player in the semiconductor equipment industry.
ASML is part of a blue-chip investment option due to the company’s strong market position and its strategic importance in the semiconductor industry. Factors that influence the stock performance includes industry trends, global demand for semiconductors, technological advancements, and macroeconomic conditions. Below we will take a look at the weekly Elliott Wave forecast of the company
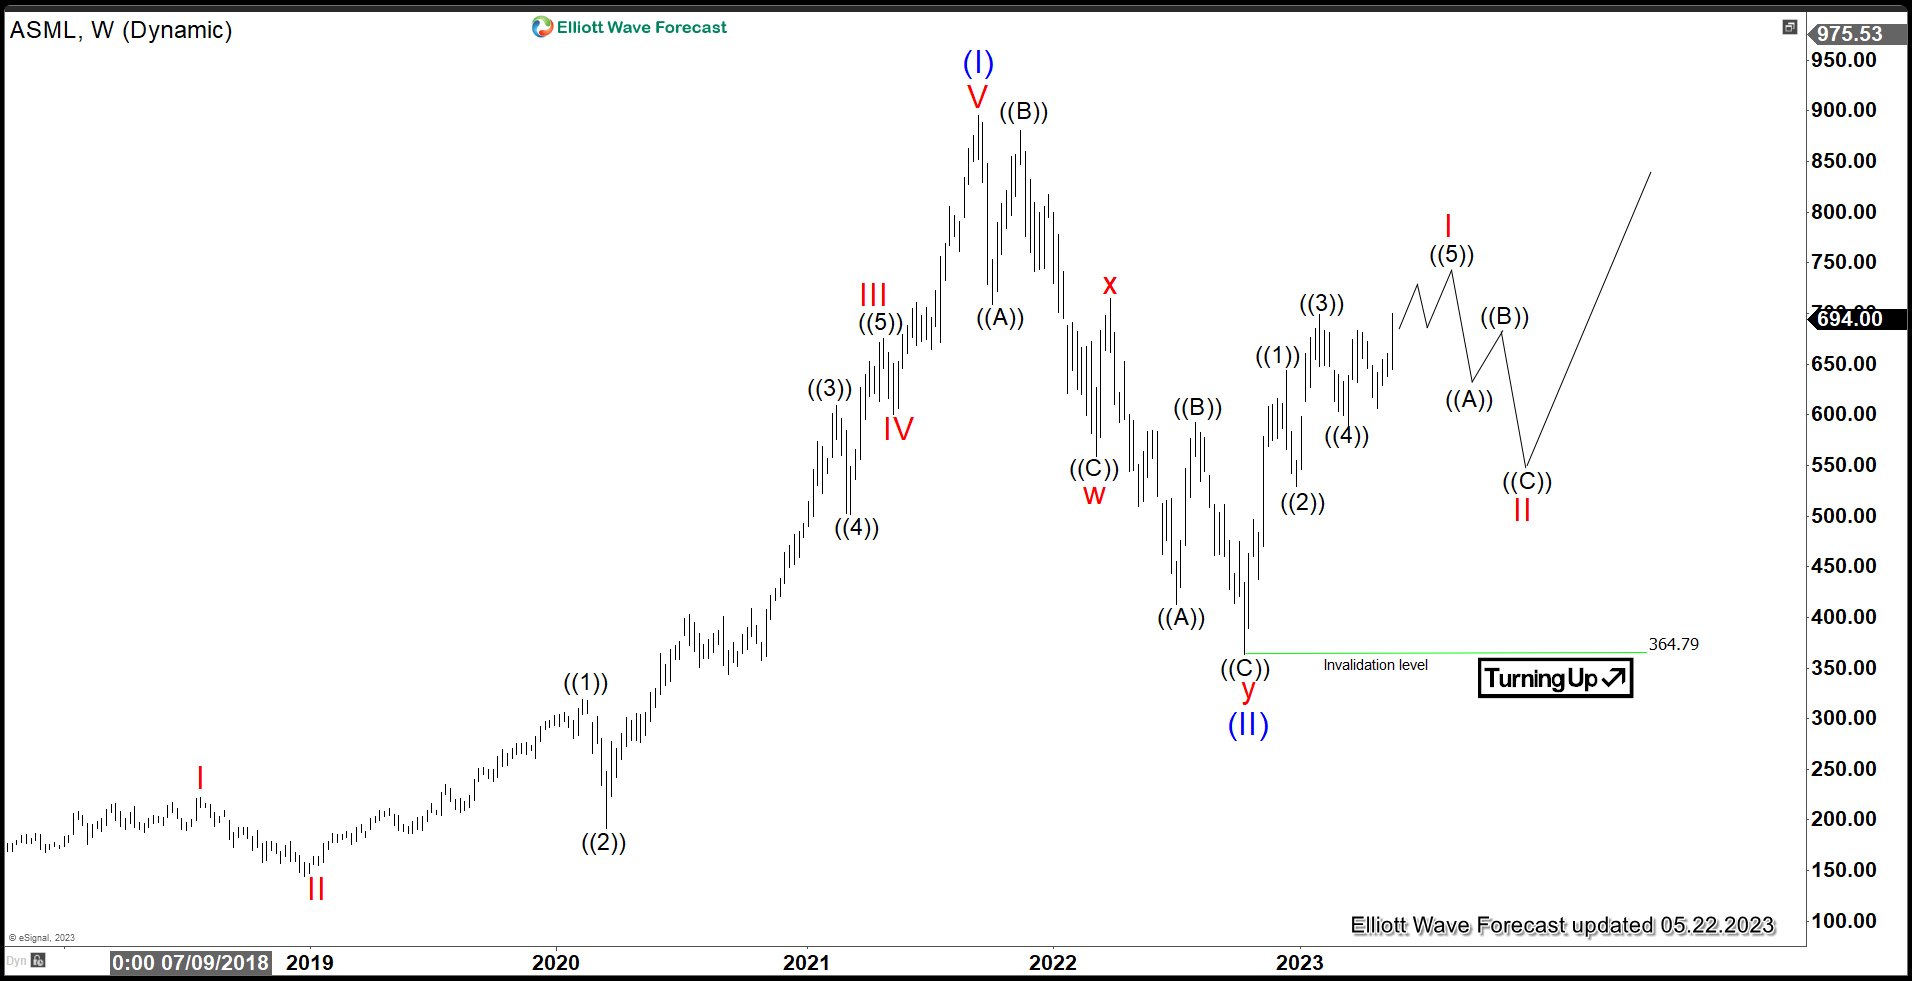
ASML Weekly Elliott Wave Chart
Weekly Elliott Wave View for ASML above suggests the stock ended wave (I) in super cycle degree at 895.93 on September 13, 2021 high. Pullback in wave (II) also ended at 364.79 and the internal subdivision took the form of a double three Elliott Wave structure. Down from wave (I), wave w ended at 558.77 and rally in wave x ended at 698.10. The stock then resumed lower in wave y towards 364.79 and completed wave (II).
The stock has turned higher in wave (III). This view will be validated if the stock manages to break above wave (I). Up from wave (II), wave ((1)) ended at 643.36 and pullback in wave ((2)) ended at 542.53. Stock then resumes higher again in wave ((3)) towards 698.59 while dips in wave ((4)) ended at 589.89. Final leg higher wave ((5)) is in progress to complete wave I, then the stock should pullback in wave II to correct cycle from 10.10.2022 low before the rally resumes.
