Once again we have seen the ASX 200 turn lower after a failed attempt to break above 7700. And when you consider the ASX has fallen double digits in percentage term from these highs, it is worth paying attention to.
By :Matt Simpson, Market Analyst
It can be beneficial to stand back to admire a view from time to time, but in the case of the ASX 200 I would highly recommend it. We can see that the ASX has repeatedly failed to test 7700 since it reached a record high in August 2021, let along break above it. And each failed attempt to do so has resulted in double-digit declines in percentage terms.

A combination of factors propelled global indices higher at the end of 2023. Of course, we had the usual Santa’s rally which tends to benefit from portfolio ‘window dressing’, but markets were also pricing in multiple rate cuts for the Fed which supported Wall Street (and all else followed). The risks of regional warfare for the Middle East has largely been ignored, but what if that changes? As for multiple cuts, a stronger US economy means that rates will remain higher for longer than current market pricing suggests. And of the wheels of the global economy fall off, you’d think indices would have to begin pricing in a hard landing and roll over from cycle highs.

ASX 200 technical analysis (weekly chart):
The ASX 200 weekly chart shows that three of the four declines from the cycle highs have been double digits in percentage terms. If the ASX Is to fall by -10% from the current cycle high, it will find itself trading beneath the 7,000 handle and the 200-week EMA.
On that note I find it interesting that the market has spent a few weeks beneath the 200-week EMA before rebounding sharply, but that is something to consider if we do see a sharp move lower. And if we’re to see another -16% drop the ASX will find itself back near the June and October 2022 lows around 6400.
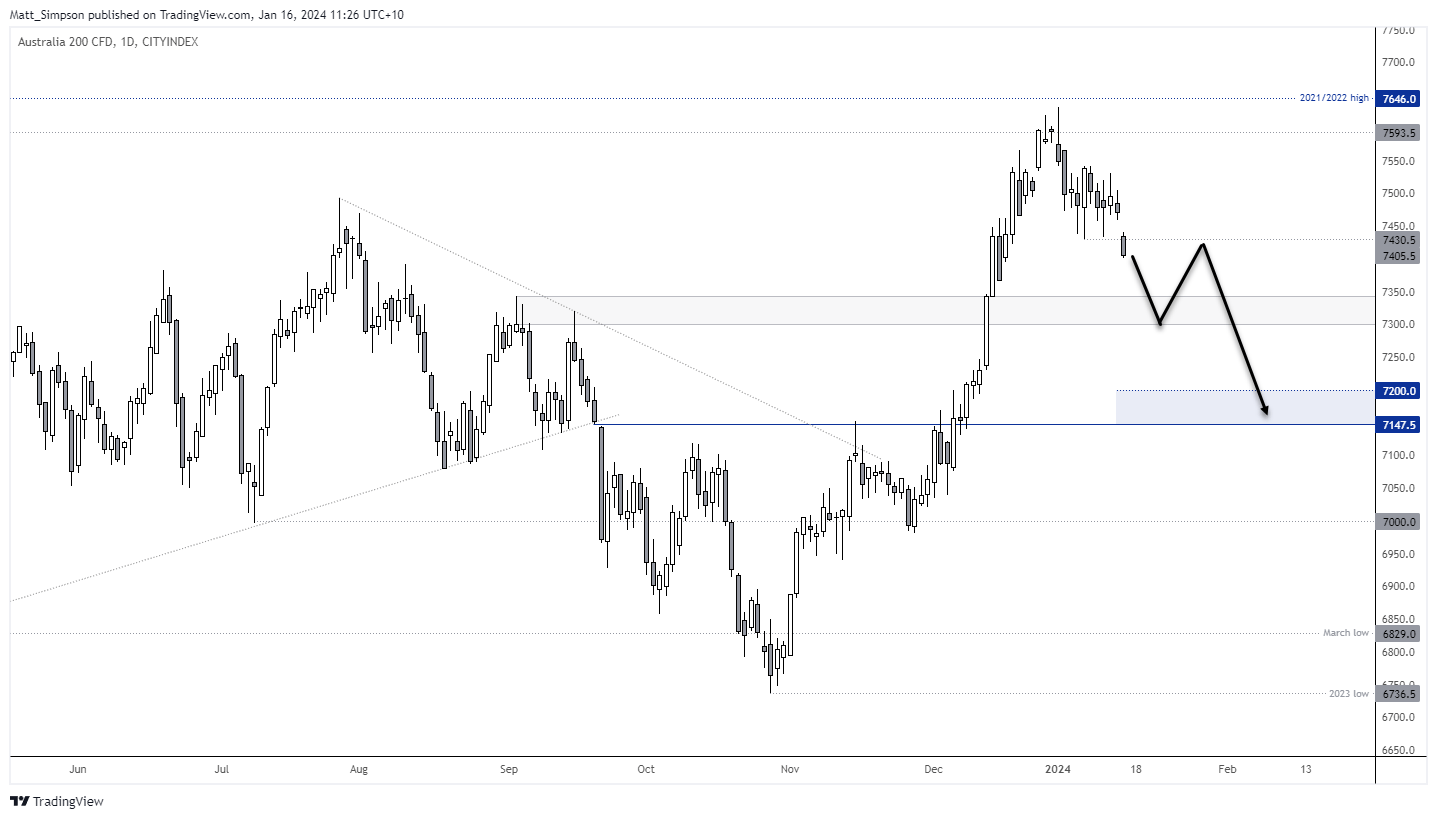
ASX 200 technical analysis (daily chart):
As bearish as the weekly chart may appear, it must be said that the trend structure on the daily does seem bullish overall. However, the ASX has fallen beneath last week’s low and AUD/USD has broken a key support area in what could be described as a mild risk-off session in Asia. Of course, to achieve 10% or more declines we’ll likely need to see wheels fall off of sentiment for global indices.
For now, a move to the 7300 – 7346 zone seems feasible whilst prices remain below 7500, a break beneath which brings 7200 and 7150 into focus for bears.
– Written by Matt Simpson
Follow Matt on Twitter @cLeverEdge
From time to time, StoneX Financial Pty Ltd (“we”, “our”) website may contain links to other sites and/or resources provided by third parties. These links and/or resources are provided for your information only and we have no control over the contents of those materials, and in no way endorse their content. Any analysis, opinion, commentary or research-based material on our website is for information and educational purposes only and is not, in any circumstances, intended to be an offer, recommendation or solicitation to buy or sell. You should always seek independent advice as to your suitability to speculate in any related markets and your ability to assume the associated risks, if you are at all unsure. No representation or warranty is made, express or implied, that the materials on our website are complete or accurate. We are not under any obligation to update any such material.
As such, we (and/or our associated companies) will not be responsible or liable for any loss or damage incurred by you or any third party arising out of, or in connection with, any use of the information on our website (other than with regards to any duty or liability that we are unable to limit or exclude by law or under the applicable regulatory system) and any such liability is hereby expressly disclaimed.