ASX 200 futures pull back from 9000 after a shooting star reversal, with technicals hinting at a corrective wave lower.
By : Matt Simpson, Market Analyst
The ASX 200 futures briefly touched the 9000 milestone last week before reversing sharply, raising the prospect of a corrective wave lower. A shooting star candle on the daily chart marked a near-term top, and while the longer-term trend remains bullish, technical signals suggest the correction may not be finished. Bears are eyeing key Fibonacci levels and moving averages as potential downside targets, while the hourly chart shows intraday weakness around the weekly pivot.
ASX 200 Futures: Technical Signals Point to Extended Correction
ASX 200 Futures (SPI 200) Technical Analysis – Daily Chart
Australia’s share market briefly touched my 9000 target last Monday before retreating. The shooting star reversal candle marked a classic near-term top and triggered a minor pullback. The daily chart trend remains strongly bullish overall, but I’m not convinced the correction has run its course. It’s not uncommon to see at least three minor corrective waves, even within a strong trend like the ASX 200.
Although we’ve seen a two-day bounce from the 10-day EMA, the bearish engulfing candle that formed overnight on ASX 200 futures is notable. It stalled near the 61.8% Fibonacci retracement, suggesting a potential lower high and the completion of wave ‘B’ in a simple ABC correction. If risk appetite weakens, a move down to the 8778 high-volume node (HVN) looks possible.
- The near-term bias remains bearish beneath the overnight high.
- A 38.2% Fibonacci level at 8833 could provide support for wave C.
- A break beneath the 10-day EMA (8911) would put the 20-day EMA (8857) and 8833 low firmly in focus.

Chart analysis by Matt Simpson - Source: TradingView, ASX SPI 200 Index Futures
ASX 200 Futures (SPI 200) Technical Analysis – 1-Hour Chart
The hourly chart shows prices holding at the weekly pivot point, which could spark a minor bounce after the open. That said, the false break above 8949 and subsequent reversal near the 61.8% Fibonacci retracement suggests the ASX 200 may have topped in the near term. Any rebounds are therefore likely to favour bears seeking opportunities to fade strength.
A weekly volume point of control (VPOC) sits at 8876, providing a potential downside target if ASX futures break below 8900 today.
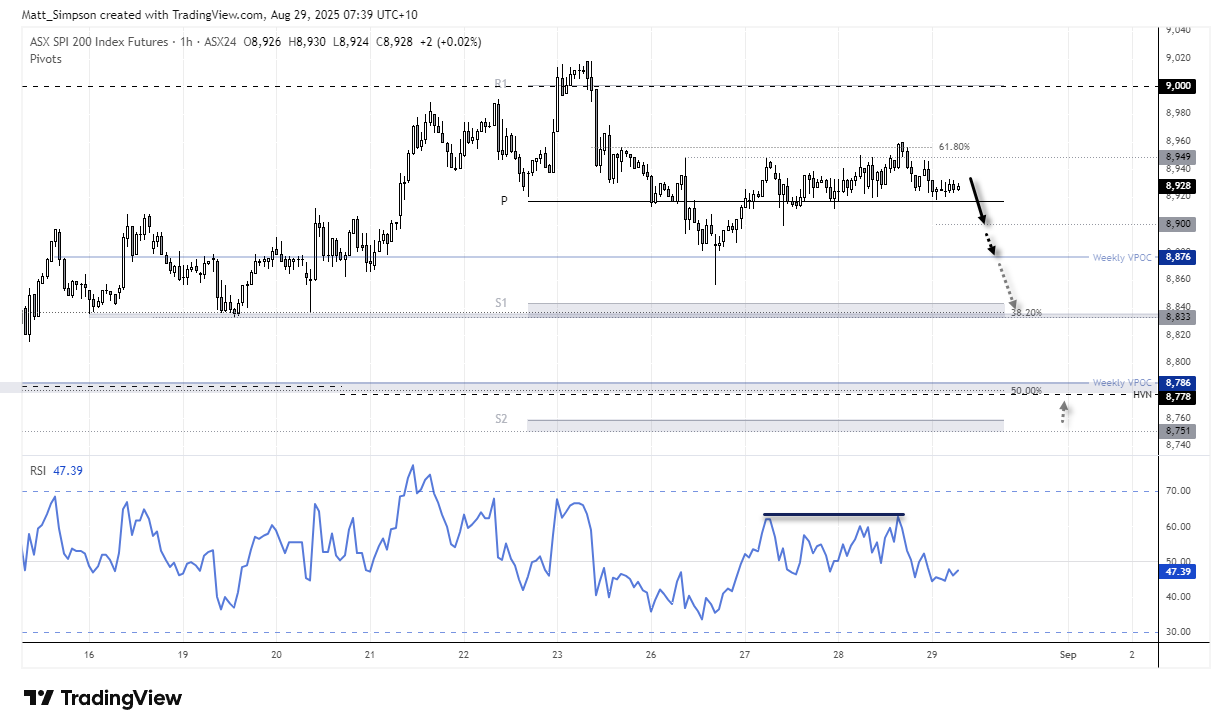
Chart analysis by Matt Simpson - Source: TradingView, ASX SPI 200 Index Futures
Key Economic Events for Traders (AEST / GMT+10)
09:30 JPY CPI, Jobs/Applications Ratio, Tokyo Core CPI, Tokyo CPI, CPI Tokyo Ex Food and Energy, Unemployment Rate (Jul/Aug) (USD/JPY, EUR/JPY, Nikkei 225)
09:50 JPY Industrial Production, Industrial Production Forecast 1m Ahead, Industrial Production Forecast 2m Ahead, Large Retailers’ Sales, Large Scale Retail Sales, Retail Sales (Jul–Sep) (USD/JPY, EUR/JPY, Nikkei 225)
11:30 AUD Housing Credit, Private Sector Credit (Jul) (AUD/USD, AUD/JPY, ASX 200)
13:00 NZD M3 Money Supply (Jul) (NZD/USD, AUD/NZD, NZD/JPY)
15:00 JPY Construction Orders, Household Confidence, Housing Starts (Jul/Aug) (USD/JPY, EUR/JPY, Nikkei 225)
16:00 EUR German Import Price Index, German Retail Sales (Jul) (EUR/USD, EUR/JPY, DAX)
17:55 EUR German Unemployment Change, German Unemployment Rate, German Unemployment, German Unemployment (Aug) (EUR/USD, EUR/GBP, DAX)
18:00 EUR Regional CPIs – Baden Wuerttemberg, Bavaria, Brandenburg, Hesse, North Rhine Westphalia, Saxony (Aug) (EUR/USD, EUR/JPY, DAX)
19:00 EUR ECB’s De Guindos Speaks (EUR/USD, EUR/GBP, DAX)
22:00 EUR German CPI, German HICP (Aug) (EUR/USD, EUR/JPY, DAX)
22:30 USD Core PCE Price Index, Goods Trade Balance, PCE Price Index, Personal Income, Personal Spending, Real Personal Consumption, Retail Inventories Ex Auto, Wholesale Inventories (Jul) (S&P 500, Nasdaq 100, USD/JPY, Gold, Crude Oil)
22:30 GDP Annualised (Q2) (USD/CAD, EUR/CAD, CAD/JPY)
23:00 USD Dallas Fed PCE (Jul) (S&P 500, Nasdaq 100, USD/JPY)
23:45 USD Chicago PMI (Aug) (S&P 500, Nasdaq 100, USD/JPY)
Saturday, August 30, 2025
00:00 USD Michigan 1-Year Inflation Expectations, Consumer Sentiment (Aug) (S&P 500, Nasdaq 100, USD/JPY)
01:00 CAD Budget Balance (Jun) (USD/CAD, EUR/CAD, CAD/JPY)
01:30 USD Atlanta Fed GDPNow (Q3) (S&P 500, Nasdaq 100, USD/JPY)
View the full economic calendar
– Written by Matt Simpson
Follow Matt on Twitter @cLeverEdge
The information on this web site is not targeted at the general public of any particular country. It is not intended for distribution to residents in any country where such distribution or use would contravene any local law or regulatory requirement. The information and opinions in this report are for general information use only and are not intended as an offer or solicitation with respect to the purchase or sale of any currency or CFD contract. All opinions and information contained in this report are subject to change without notice. This report has been prepared without regard to the specific investment objectives, financial situation and needs of any particular recipient. Any references to historical price movements or levels is informational based on our analysis and we do not represent or warranty that any such movements or levels are likely to reoccur in the future. While the information contained herein was obtained from sources believed to be reliable, author does not guarantee its accuracy or completeness, nor does author assume any liability for any direct, indirect or consequential loss that may result from the reliance by any person upon any such information or opinions.
Futures, Options on Futures, Foreign Exchange and other leveraged products involves significant risk of loss and is not suitable for all investors. Losses can exceed your deposits. Increasing leverage increases risk. Spot Gold and Silver contracts are not subject to regulation under the U.S. Commodity Exchange Act. Contracts for Difference (CFDs) are not available for US residents. Before deciding to trade forex, commodity futures, or digital assets, you should carefully consider your financial objectives, level of experience and risk appetite. Any opinions, news, research, analyses, prices or other information contained herein is intended as general information about the subject matter covered and is provided with the understanding that we do not provide any investment, legal, or tax advice. You should consult with appropriate counsel or other advisors on all investment, legal, or tax matters. References to FOREX.com or GAIN Capital refer to StoneX Group Inc. and its subsidiaries. Please read Characteristics and Risks of Standardized Options.