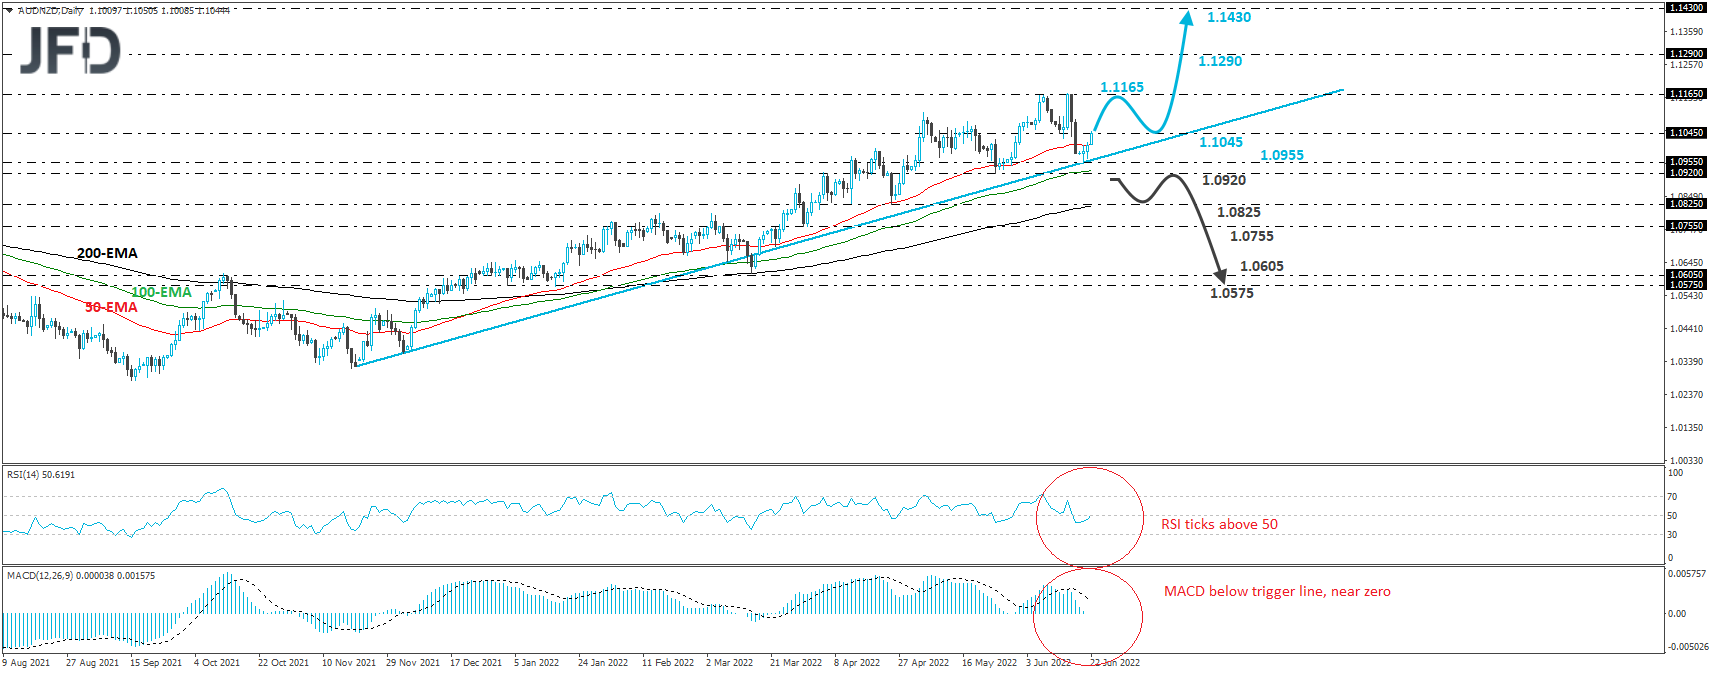
AUD/NZD traded higher recently after hitting support near 1.0955 on Monday. At that moment, that barrier coincided with the upside support line drawn from the low of November 18th. So, bearing in mind that the rate remains above that upside line, we will consider the medium-term picture to be positive.
At the time of writing, the rate is testing the 1.1045 zone, where a break could aim for the key resistance of 1.1165, marked by the highs of June 7th and 15th. If the bulls are not willing to stop there, then a break higher will confirm a forthcoming higher high and may pave the way towards 1.1290, a resistance marked by the high of October 2017. Another break, above 1.1290 could carry extensions towards the 1.1430 zone, marked by the high of July 2015.
Shifting attention to our daily oscillators, we see that the RSI turned up and appears ready to move back above its 50 line, while the MACD, lies below its trigger line, slightly above zero. It could start bottoming as well soon. The RSI suggests that the rate may start gathering upside speed soon, while the MACD has yet to do so. That’s another reason why we prefer to wait for a break above 1.1045 before getting confident on further advances.
On the downside, we would like to see a clear break below 1.0920, marked by the low of May 25th, before we start examining the case of a bearish reversal. This could confirm the break below the aforementioned upside line and may initially target the 1.0825 level, or the 1.0755 barrier, marked by the lows of April 25th and the low of March 3t0h, respectively. If neither territory is able to invite enough bulls, then a break lower may encourage the bears to push towards the low of March 15th, at 1.0605, or the low of January 17th, at around 1.0575.
Disclaimer:
The content we produce does not constitute investment advice or investment recommendation (should not be considered as such) and does not in any way constitute an invitation to acquire any financial instrument or product. The Group of Companies of JFD, its affiliates, agents, directors, officers or employees are not liable for any damages that may be caused by individual comments or statements by JFD analysts and assumes no liability with respect to the completeness and correctness of the content presented. The investor is solely responsible for the risk of his investment decisions. Accordingly, you should seek, if you consider appropriate, relevant independent professional advice on the investment considered. The analyses and comments presented do not include any consideration of your personal investment objectives, financial circumstances or needs. The content has not been prepared in accordance with the legal requirements for financial analyses and must therefore be viewed by the reader as marketing information. JFD prohibits the duplication or publication without explicit approval.
CFDs are complex instruments and come with a high risk of losing money rapidly due to leverage. 72.99% of retail investor accounts lose money when trading CFDs with the Company. You should consider whether you understand how CFDs work and whether you can afford to take the high risk of losing your money. Please read the full Risk Disclosure.
Copyright 2022 JFD Group Ltd.