It will likely take more than one bearish reversal candle to spoil the bullish trend structure of AUD/USD, and there’s plenty of support nearby to excite dip buyers. USD/JPY has likely returned to a shell-socked state after a surge of volatility toppled the pair for a clear break below 160.
By :Matt Simpson, Market Analyst
The US inflation report was about as good as any dove could have hoped for, with all headline figures falling below expectations. We’ve now seen the complete set of weak CPI, PCE, NFP and ISM reports to more than suggest the US economy is slowing. And that will no doubt pounced upon in Trump’s election campaign, but for now the focus remains on the Fed.
Fed fund futures now imply a 93% probability of four 25 bp cuts by March, up from an 88% probability of four by April. A 25bp cut in September is estimated at 84.6%. And the market reactions were impressive particularly across yen pairs.

-
USD/JPY plunged -1.7% within 15-minutes of the release and made light work of its break beneath 160 to reach an overnight low of 157.7. It’s daily high-to-low range was -2.7%, although it parred losses to close the day -1.7%, and the Japanese yen also rose at least 1.2% against all other FX majors.
-
The US dollar index fell -0.5% to a 4-week low during its worst day in a month, although prices recovered slightly to close back above 1.4 by the close
-
EUR/USD reached my 1.09 target outlined in yesterday’s pre-CPI report and, like AUD/USD, shows the potential to extend its gains over the coming weeks
-
Gold rose to a 7-week high with a form close above $2400, and bulls are now likely eyeing a fresh record high
-
Wall Street appeared to take the data as a sign that something has broken, with S&P 500 futures contract erasing most of Wednesday’s gains and the Nasdaq 100 forming a prominent bearish outside day
-
Nikkei futures tracked the Nasdaq lower to snap a 3-day winning streak and topped it from its own record high
-
The SPI 200 (ASX 200 futures) closed above 7900 to just 9-points below the May high, a break above which brings the records high of 7953 into focus

Events in focus (AEDT):
- 08:30 – NZ business PSI
- 08:45 – NZ retail sales, food price index
- 10:00 – SG GDP
- 12:00 – CN trade balance
- 14:30 – JP capacity utilisation
- 16:45 – FR CPI
- 17:00 – ES CPI
- 22:30 – US PPI
Click the website link below to get our exclusive Guide to AUD/USD trading in H2 2024.
https://www.forex.com/en-us/market-outlooks-2024/h2-aud-usd-outlook/

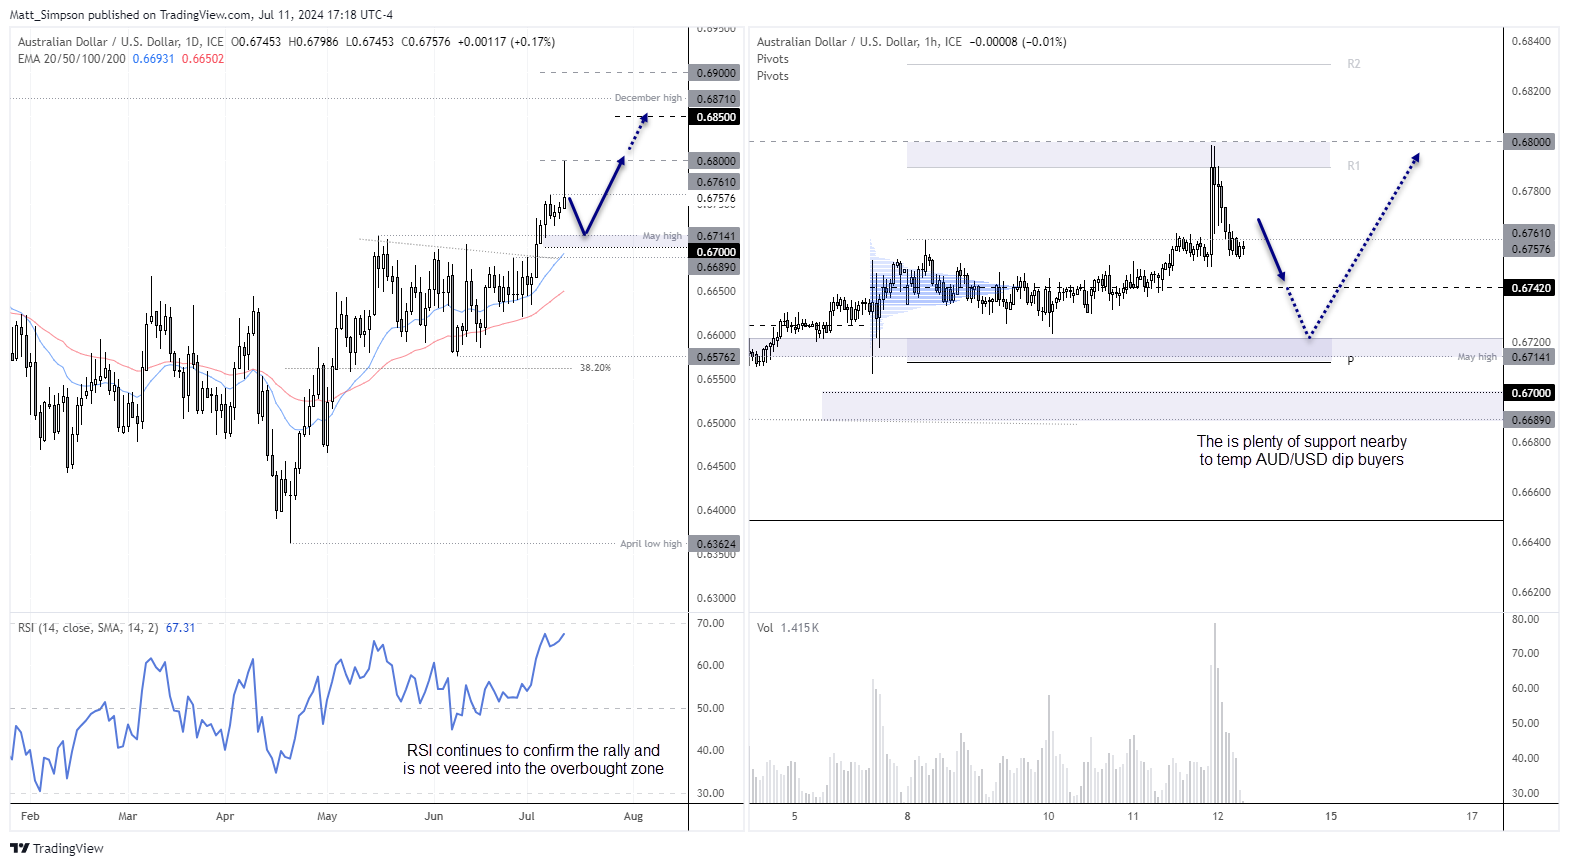
AUD/USD technical analysis:
The Australian dollar initially spiked higher by 0.8% before handing back a chunk of those gains, leaving a bearish pinbar on the daily chart. The daily high also coincided with the upper 1-week implied volatility band mentioned in Monday’s report. Whilst this could point to further weakness for AUD/USD, I suspect its downside could be limited.
The daily trend structure remains solid for the bull camp, and one bearish reversal candle likely does not spell the end of the world for AUD/USD bulls. The daily RSI (14) continues to confirm price action yet has not strayed into overbought territory, and the bias remains for prices to continue higher once the dust has settled from Thursday’s volatility.
Pullbacks towards the May high (0.6714) to 76c could appeal to bullish swing traders, who still have their eye on a move back to the December high (0.6871) or even 69c.
Still, the highest volume bar on the 1-hour chart coincided with the first bearish candle after the CPI release, so we may find that upside potential is limited for now. There is a high-volume node at 0.6742 within the prior consolidation which could act as a magnet for prices over the near-term.
USD/JPY technical analysis:
Looking at the 100-tick chart (right), it shows that prices gapped lower 2 milliseconds seconds before the CPI data was supposedly released. Over the next 3 seconds, it fell 50 pips, and this means the 161.03 – 161.53 range marks a likely liquidity gap which could be filled in the future. But I very much doubt we’ll see such a rebound today.
The sudden sell-off on USD/JPY marked the beginning of its worst day in 10 weeks, falling -1.7% by the day’s close. It made light work of breaking back beneath the 1990 high (160.16) and April MOF intervention level (160.18) and the 160 handle before the real selling began.
Click the website link below to get our exclusive Guide to USD/JPY trading in H2 2024.
https://www.forex.com/en-us/market-outlooks-2024/h2-usd-jpy-outlook/

I suspect USD/JPY has now entered a shell-shocked state once more, which means the burst of volatility seen on Thursday is not likely to be met today in Asia. Its daily low almost perfectly respected the lower Keltner Band on the daily chart and recovered back above the May 1st MOF intervention level at 158.
For now, I suspect we’ll see a minor secondary reaction lower in today’s Asian session before prices drift higher but remain below 160, where we might then see another wave of selling. But with data finally backing multiple Fed cuts, the path of least resistance could indeed be lower for the US dollar in general

View the full economic calendar
– Written by Matt Simpson
Follow Matt on Twitter @cLeverEdge
The information on this web site is not targeted at the general public of any particular country. It is not intended for distribution to residents in any country where such distribution or use would contravene any local law or regulatory requirement. The information and opinions in this report are for general information use only and are not intended as an offer or solicitation with respect to the purchase or sale of any currency or CFD contract. All opinions and information contained in this report are subject to change without notice. This report has been prepared without regard to the specific investment objectives, financial situation and needs of any particular recipient. Any references to historical price movements or levels is informational based on our analysis and we do not represent or warranty that any such movements or levels are likely to reoccur in the future. While the information contained herein was obtained from sources believed to be reliable, author does not guarantee its accuracy or completeness, nor does author assume any liability for any direct, indirect or consequential loss that may result from the reliance by any person upon any such information or opinions.
Futures, Options on Futures, Foreign Exchange and other leveraged products involves significant risk of loss and is not suitable for all investors. Losses can exceed your deposits. Increasing leverage increases risk. Spot Gold and Silver contracts are not subject to regulation under the U.S. Commodity Exchange Act. Contracts for Difference (CFDs) are not available for US residents. Before deciding to trade forex, commodity futures, or digital assets, you should carefully consider your financial objectives, level of experience and risk appetite. Any opinions, news, research, analyses, prices or other information contained herein is intended as general information about the subject matter covered and is provided with the understanding that we do not provide any investment, legal, or tax advice. You should consult with appropriate counsel or other advisors on all investment, legal, or tax matters. References to FOREX.com or GAIN Capital refer to StoneX Group Inc. and its subsidiaries. Please read Characteristics and Risks of Standardized Options.