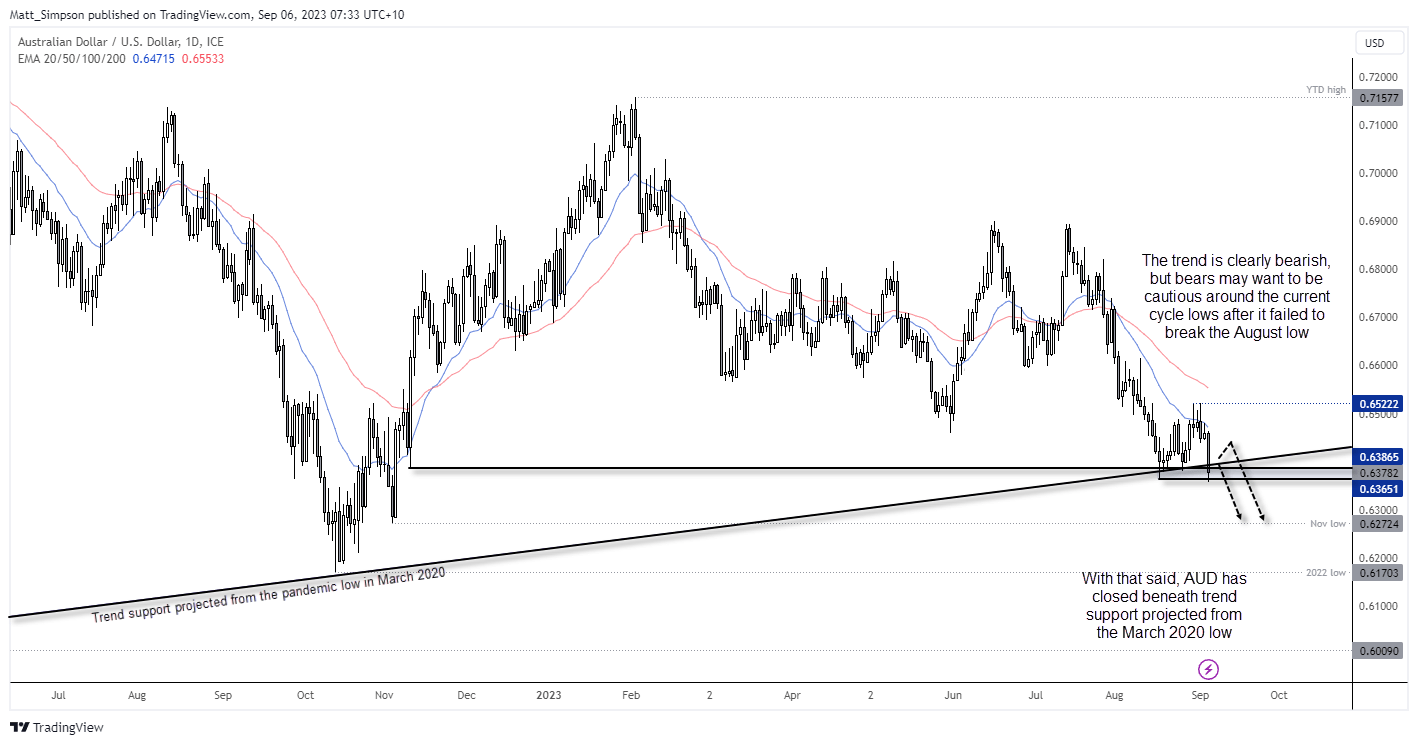
AUD/USD technical analysis (daily chart):
The combination of rising US bond yields, yet more weak data from China and the reinforced belief that the RBA are done with hiking interest rates saw AU/USD touch a fresh YTD low during its worst session in nearly five weeks. And the 0.6365 – 0.6400 support zone which I assumed would do a batter job of holding is very close to snaping.
If there is any reason for bears to be wary today, it’s that AUD/USD only briefly traded beneath the August low by a few pips before reverting slightly higher – and that hardly makes it a compelling breakout. With that said, the trend is clearly bearish and momentum turned lower after AUD/USD repeatedly failed to close above the 20-day EMA last week. Form here, bears may want to fade into minor rallies with yesterday’s bearish range-expansion day or wait for a break to new lows.
Australia’s Q2 GDP is released in a couple of hours. Perhaps it can give the Aussie a little boost for bears to fade into.
