AUDJPY reacts at the bue box area
The 1 hour AUDJPY chart below is from 3/26/2021. The pair reached the blue box down from the blue wave (3) peak. In blue wave (4), the pair subdivided into red A-B-C zig zag . As one would expect, red waves A and C were impulse waves. In red wave B, we have another ((a))-((b))-(©) zig zag, albeit smaller in size to the one described earlier. At the blue box, the pair reacted at 82.297 blue wave (4) low. While above there, we expect the pair to trade higher. Long positions from the blue box were already runnig risk free as at 3/26/2021.
Elliott Wave 1 hour chart from 3/26/2021 Asia Update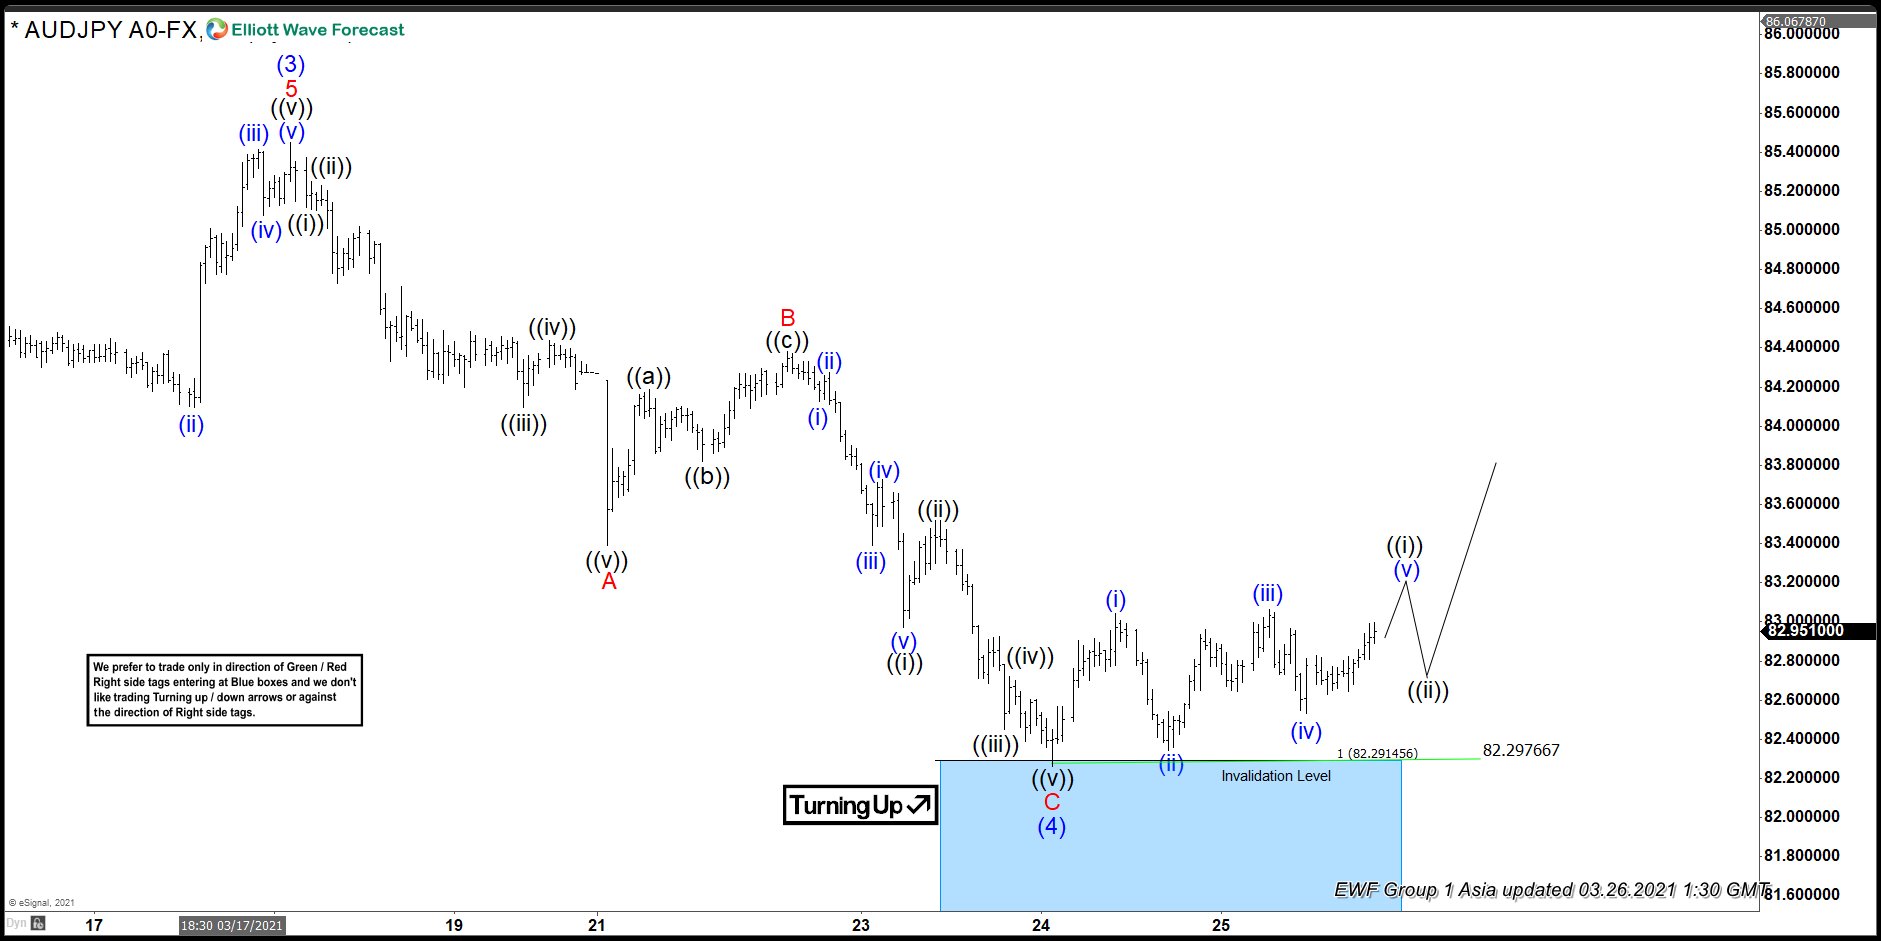
In the chart below, which is from 3/27/2021 weekend update, we see further separation higher from the blue box. We propose that black wave ((i)) completed at around 83.033 area. Wave ((ii)) is also proposed completed around 83.369 area. While the pair remains above black wave ((ii)) low, we expect it to continue rallying to the upside.
The recent price structure on the chart below, shows the pair in black wave ((iii))). Usually, third waves are extented relative to first waves. The extension of a third wave is confirmed once the relationship between the first and the third wave exceeds 161.8%. This measurement is achieved by use of a Fibonacci extension tool. We expect black wave ((iv)) and ((v)) to follow thereafter, and complete red wave 1. A break above blue wave (3) peak shall confirm the next leg higher in (5). However a break below 82.297 will suggest a double correction lower in (4). The right side, though; is upside.
Elliott Wave 1 hour chart from 3/27/2021 Weekend Update 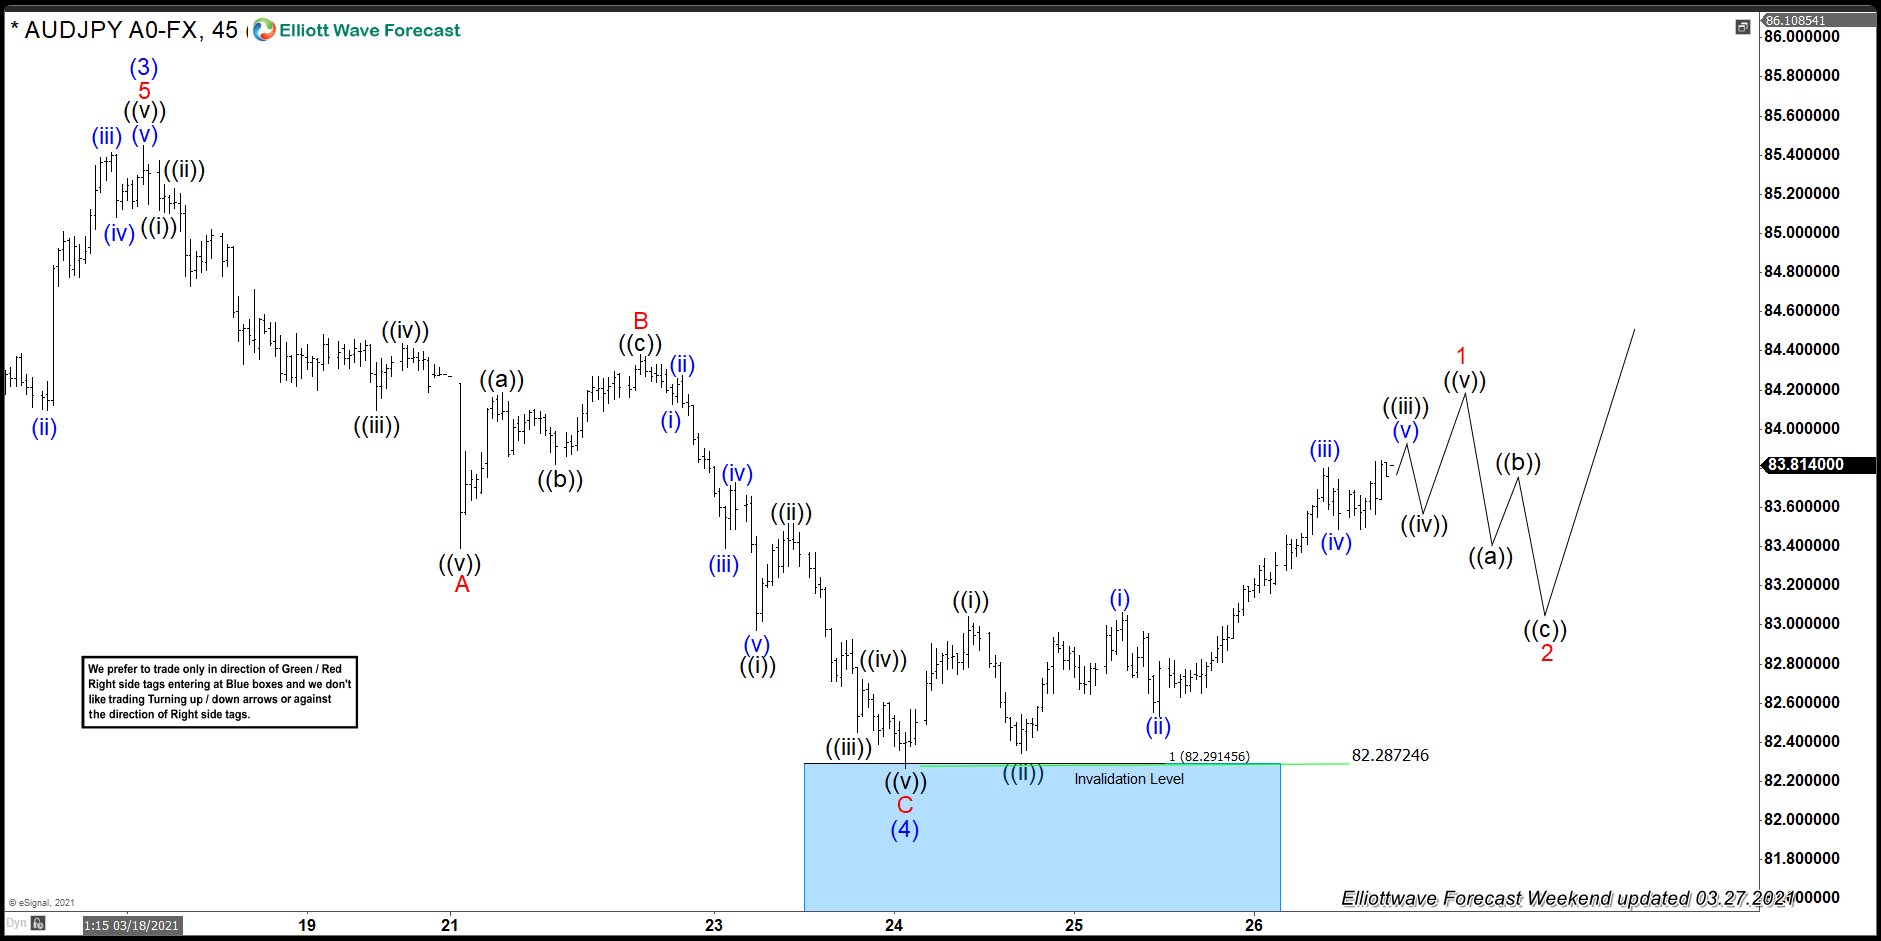
Source: AUDJPY Rallies From The Blue Box