The Aussie’s been on a tear, riding a wave of narrowing yield differentials and China’s stock market rebound. But with a key technical level in sight, will the rally have legs, or are sellers ready to pounce?
By : David Scutt, Market Analyst
- AUD/USD rally driven by narrowing yield spreads and surging China equities
- Aussie 10-year yields top U.S. Treasuries for first time in 2025
- Strong AUD/USD correlations with Hang Seng, CSI 300, and USD/CNH
- Key test ahead as AUD/USD nears major technical resistance
Summary
Narrowing yield differentials and surging sentiment towards Chinese stocks have powered a strong AUD/USD rally, putting it on the cusp of a major technical breakout. While RBA commentary on Friday could provide the catalyst, a more likely spark may come from Hong Kong’s Hang Seng or Japan’s January inflation report.
Click the website link below to read our exclusive Guide to USD/JPY trading in 2025

A Rally Powered by Multiple Sources
A robust Australian jobs report, hawkish RBA rhetoric, and remarks from U.S. officials—Trump floating the possibility of a China trade deal and Treasury Secretary Scott Bessant outlining plans to lower long-term rates—have helped push Australian 10-year bond yields above U.S. Treasuries for the first time in 2025.
As shown in the chart below, that shift has been key to the Aussie’s resurgence, with the AUD/USD correlation to benchmark yield spreads strengthening to 0.82 over the past fortnight. The two-year yield spread—more reflective of central bank expectations—has been only slightly weaker at 0.78.
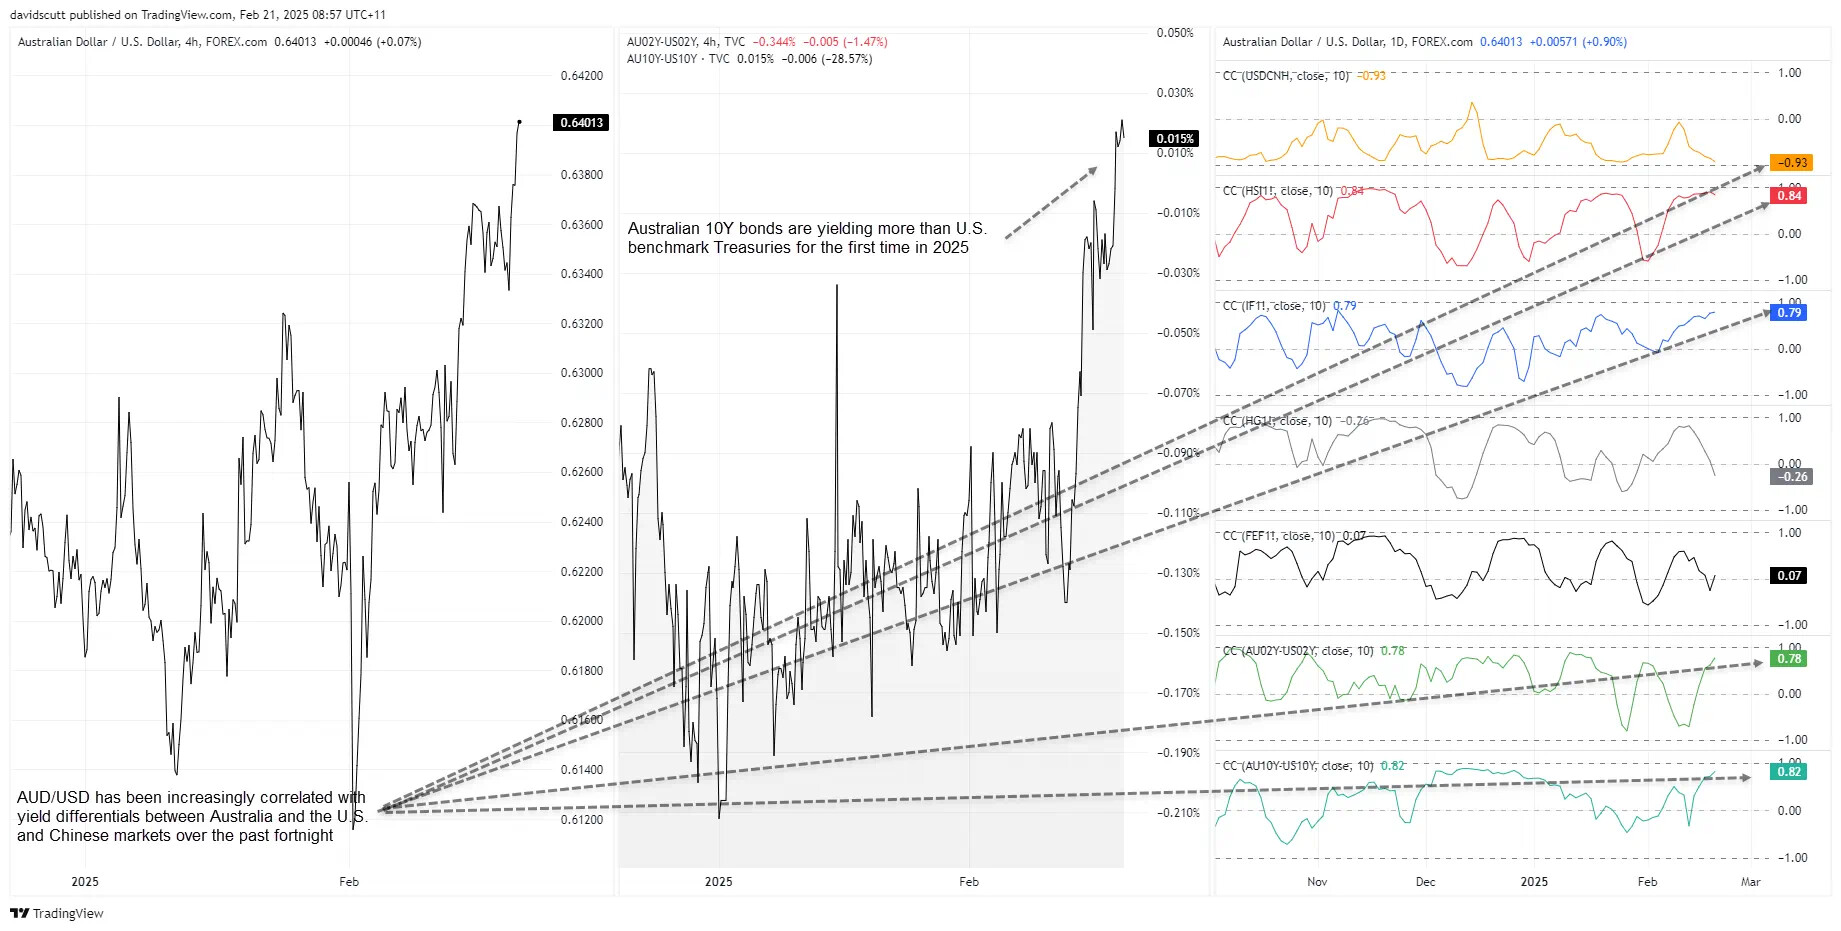
Source: TradingView
While yield differentials remain an important driver, the real tailwind appears to be the resurgence in Chinese equities, particularly tech giants listed on the Hang Seng. The fundamental link is tenuous at best, but for a currency often used as a proxy for China sentiment, massive gains on the Hang Seng are clearly supporting AUD/USD. The rolling 10-day correlation between AUD/USD and Hang Seng futures sits at 0.82, with CSI 300 futures not far behind at 0.79.
That China connection is even clearer when looking at AUD/USD’s rolling correlation with USD/CNH over the past fortnight, sitting at -0.93—both currencies moving almost in lockstep against the U.S. dollar.
Implications for Trade Setups
For trade setups, Chinese markets will be key in determining whether AUD/USD can break higher. While RBA officials are addressing policymakers on Friday, the proximity of Australia’s federal election suggests the event may be overshadowed by politics, reducing the likelihood of meaningful rate signals.
Given recent yen strength, Japan’s inflation report may have a greater impact via its implications for the U.S. dollar. You can find the preview here. After Thursday’s USD/JPY move, an in-line inflation print may be needed to prevent a yen reversal, while an upside surprise could weigh on the U.S. dollar.
Click the website link below to read our exclusive Guide to AUD/USD trading in 2025

AUD/USD Technical Analysis
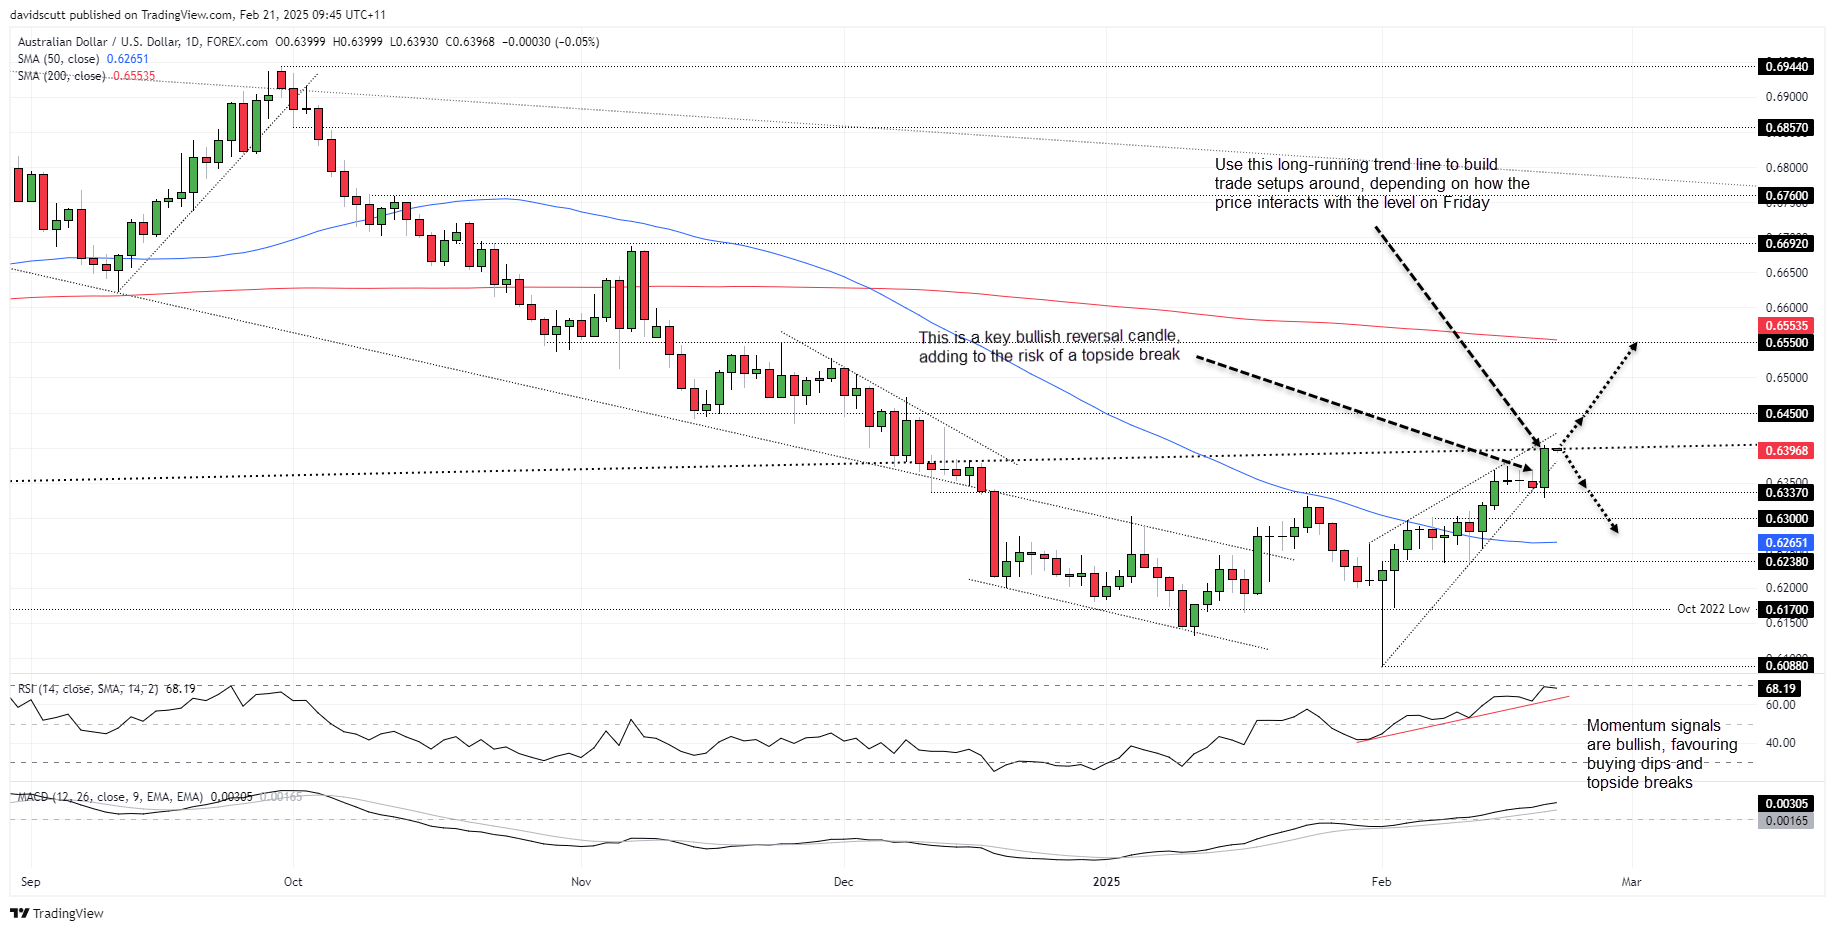
Source: TradingView
From a technical perspective, AUD/USD is testing a major uptrend dating back to October 2022. It bounced strongly off this level multiple times when trading above it—now below, the question is whether sellers will defend it just as aggressively. I’m not convinced, but I’ll let price action dictate the approach.
Momentum indicators favour the bulls, with RSI (14) trending higher but not yet overbought and MACD continuing to rise, reinforcing a near-term upside bias. A clean break above the trendline could see .6450 tested, followed by .6550—both key levels in late 2024, with the 200-day moving average just above the latter.
For longs on a breakout, a stop beneath the trendline offers protection. Conversely, if AUD/USD fails to break higher, shorts could be positioned beneath it with a stop above. A move below .6337 could open the door for a test of .6300 or the 50-day moving average, marking a bearish break of the rising wedge the pair has been trading in.
– Written by David Scutt
Follow David on Twitter u/scutty
From time to time, StoneX Financial Pty Ltd (“we”, “our”) website may contain links to other sites and/or resources provided by third parties. These links and/or resources are provided for your information only and we have no control over the contents of those materials, and in no way endorse their content. Any analysis, opinion, commentary or research-based material on our website is for information and educational purposes only and is not, in any circumstances, intended to be an offer, recommendation or solicitation to buy or sell. You should always seek independent advice as to your suitability to speculate in any related markets and your ability to assume the associated risks, if you are at all unsure. No representation or warranty is made, express or implied, that the materials on our website are complete or accurate. We are not under any obligation to update any such material.
As such, we (and/or our associated companies) will not be responsible or liable for any loss or damage incurred by you or any third party arising out of, or in connection with, any use of the information on our website (other than with regards to any duty or liability that we are unable to limit or exclude by law or under the applicable regulatory system) and any such liability is hereby expressly disclaimed.