Hello Traders! Today, we will look at the Elliott Wave structure of Australian Securities Exchange Ltd (ASX) and explain why more downside can happen before higher soon.
Australian Securities Exchange Ltd (ASX) is an Australian public company that operates Australia’s primary securities exchange. The ASX was formed on 1 April 1987, through incorporation under legislation of the Australian Parliament as an amalgamation of the six state securities exchanges, and merged with the Sydney Futures Exchange in 2006. Today, ASX has an average daily turnover of A$4.685 billion and a market capitalization of around A$1.6 trillion, making it one of the world’s top 20 listed exchange groups, and the largest in the southern hemisphere.
Third Wave Extension
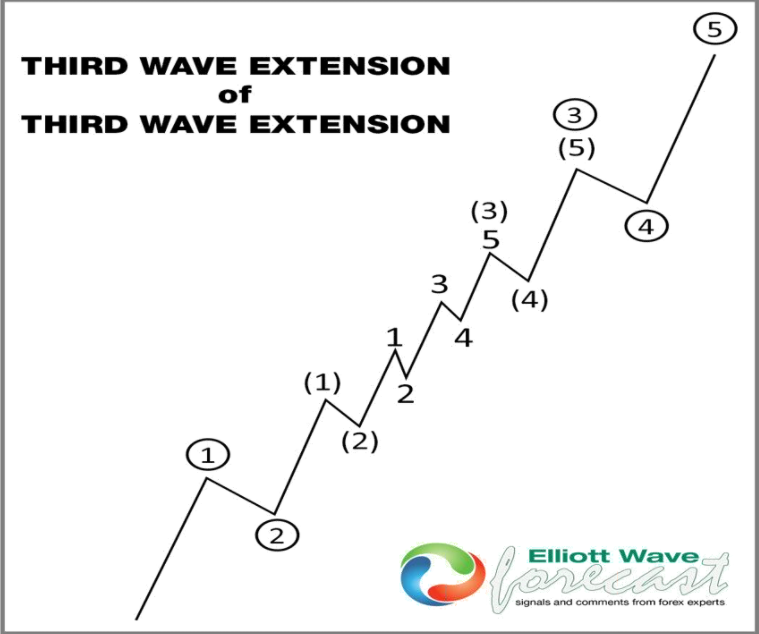
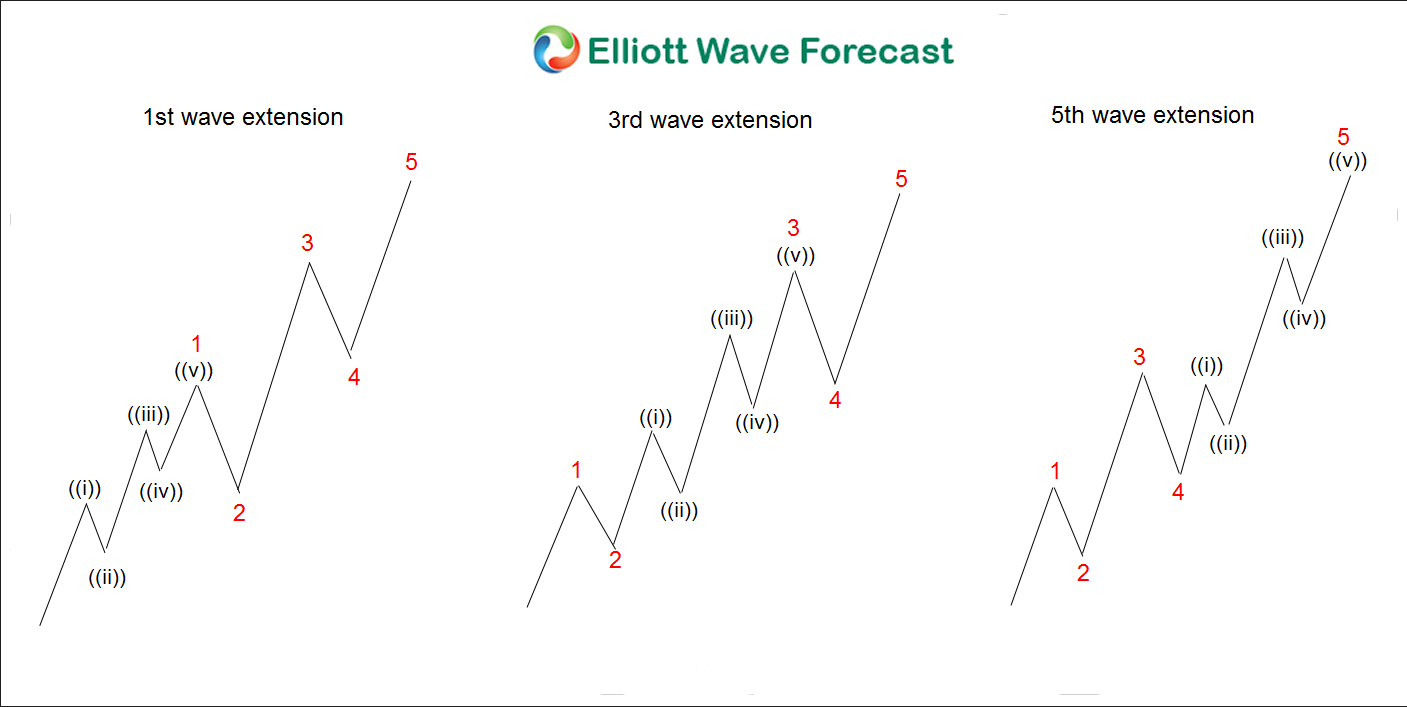
Different Types of Wave Extensions
Before we deep dive into the chart, I want to explain that the overall structure looks like a nest. A nest is a series of 1-2. Most of the time a nest happens before a huge move takes place. The chart above shows what a nest looks like.
ASX Monthly Elliott Wave View Nov 06 2023:
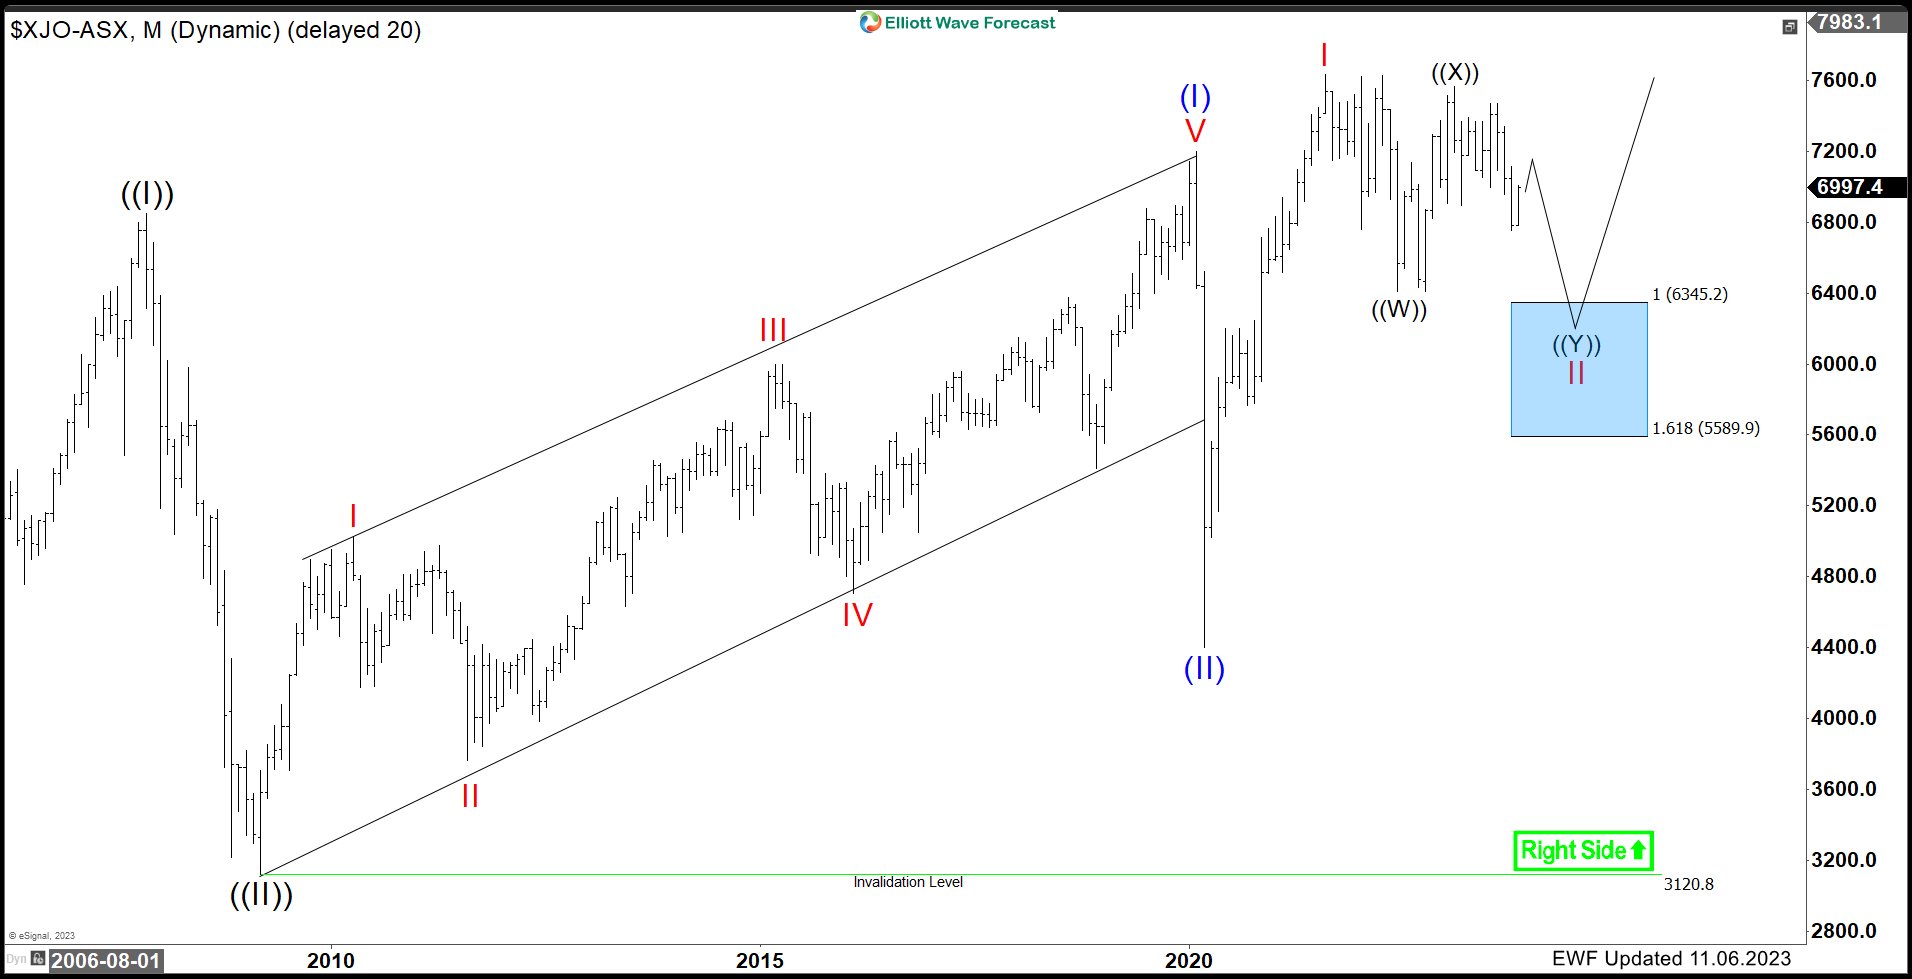
The Monthly chart above shows the Super cycle from 2009 lows at $3120.80 unfold in a 5 wave diagonal structure suggesting a bullish sequence. The rally peaked on Feb 2020 and started the pullback to correct the 2009 cycle. The pullback found a low in March 2020 at blue (II) and rallied again in 5 waves making a new All Time High in August 2021. This created another bullish sequence against March 2020 lows. The pullback to correct March 2020 is still unfolding in a corrective manner (WXY). We have completed 2 out of 3 legs down and missing the final move lower into a blue box area at $6345.20 - 5589.90 where we expect buyers to enter for a reaction higher and eventually take it to new all time highs again.