Some rules within The Elliott wave Theory can be subjective as it allows flexible and various alternatives. However, one of the stronger points in the theory is the sequence of five. In the Elliott Wave Theory, wave 5 is located at the end of an impulsive structure. The main pattern is the five waves followed by three waves back. Afterwards, more upside in the direction of the five waves should follow. The graphic below shows the illustration:
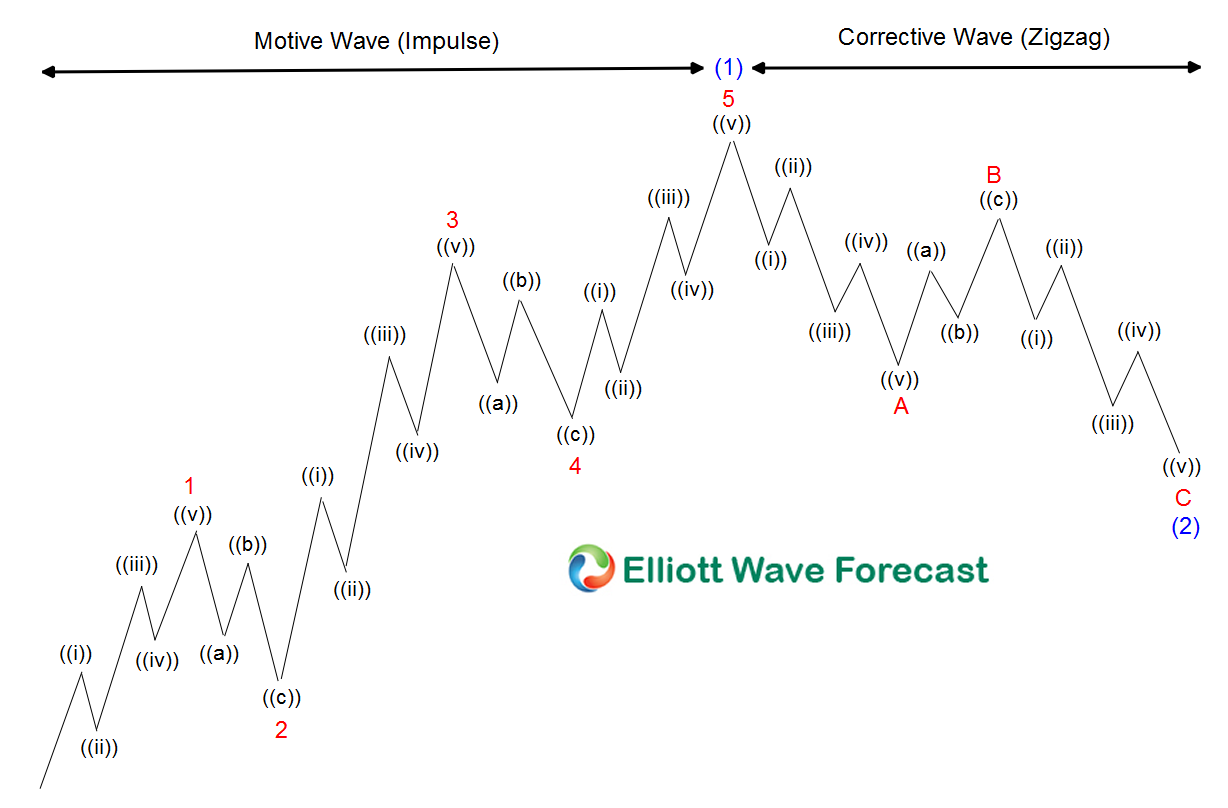
- There are five waves off the lows.
- Each leg comes with a subdivision of five waves.
- After the five waves, a three waves pullback happens to correct the cycle, before more upside in the previous five waves’ direction.
Thus, one significance of the number five is it signals the right side of the market. In an impulsive structure, the right side of the market is the direction where the 5 waves is heading.
Another significance of the number five is when it’s doing a double three correction (WXY). The primary correction, in the Theory, is the well known ABC zigzag. Sometimes the primary trend is not that strong, and the market ends up doing a seven swing structure. The idea of a seven swing correction suggests the market has to go through a process of a five and six swing before ending seven swing. Thus, within 7 swing corrective structure, when five swings correction are in place, the right side becomes apparent, and more extension in that direction should follow.
The Following chart below gives the illustration of a 7 swing structure :
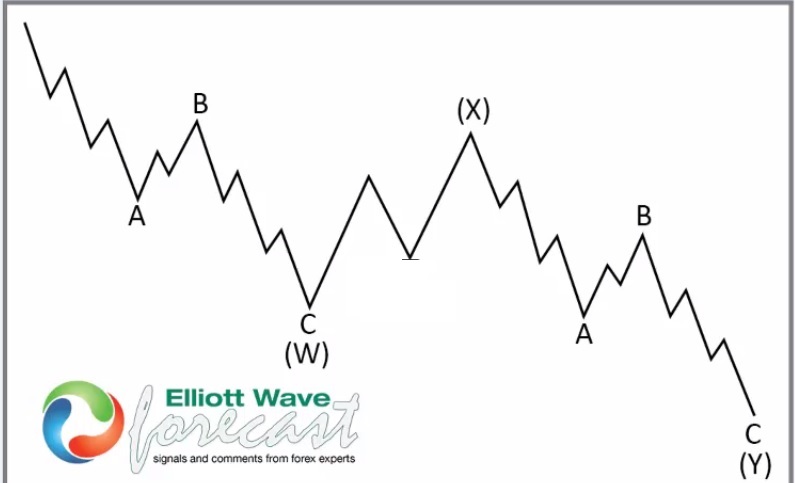
The above graphic is an example of the WXY or a seven swing structure. The fifth swing in the example above is at wave A of (Y). At this point, we can identify 5 swings from the top, suggesting more downside to follow to end 7 swing structure.
Another significance of the number five is when the market is nesting. A nest is a sequence the market follows before a strong acceleration in the direction of the right side. Many times the nest happens in wave three of a five waves impulse. Knowing the right side and possibilities before the break is critical, and the number five is vital. The following chart shows wave 3 extension in different nesting structure:
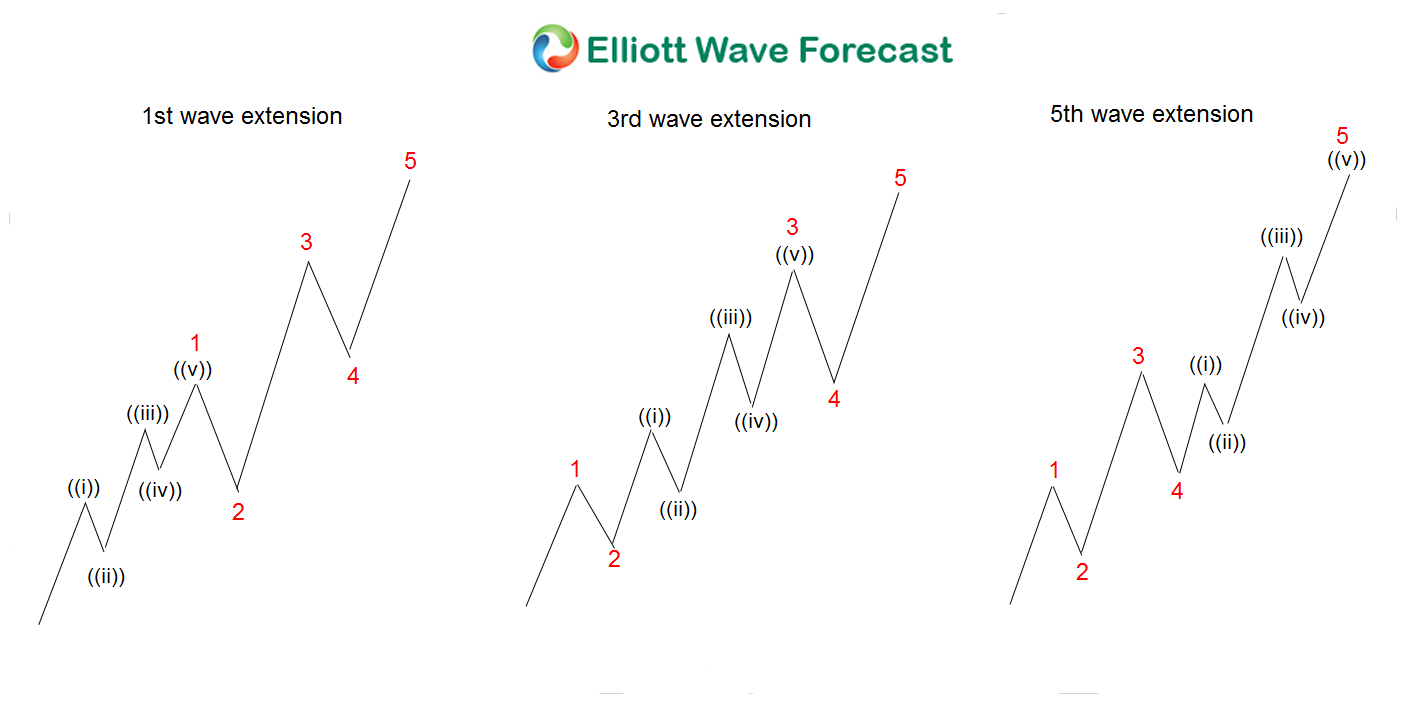
We can see from above the three nesting possibilities can be either in wave I, wave III, or wave V.
The reality is that nobody knows the future with a hundred percent certainty, but understanding the Theory and how to apply it is the key. Many traders tend to overthink the Theory and ending up either missing the move or get caught at the wrong side. The following chart from Boeing below illustrates the nesting principle:
Boeing (BA) Daily Elliott Wave Chart

The chart above shows how Boeing shows five swings off the lows at March 2020. This means that one of the three possibilities explained above will end soon. It can either be a diagonal (5 waves from March low), or it can be a 5 swing of WXY, or it can be a nest. At this moment, we favor the nest due to the monthly sequences presented in the following chart below:
Boeing (BA) Weekly Elliott Wave Chart
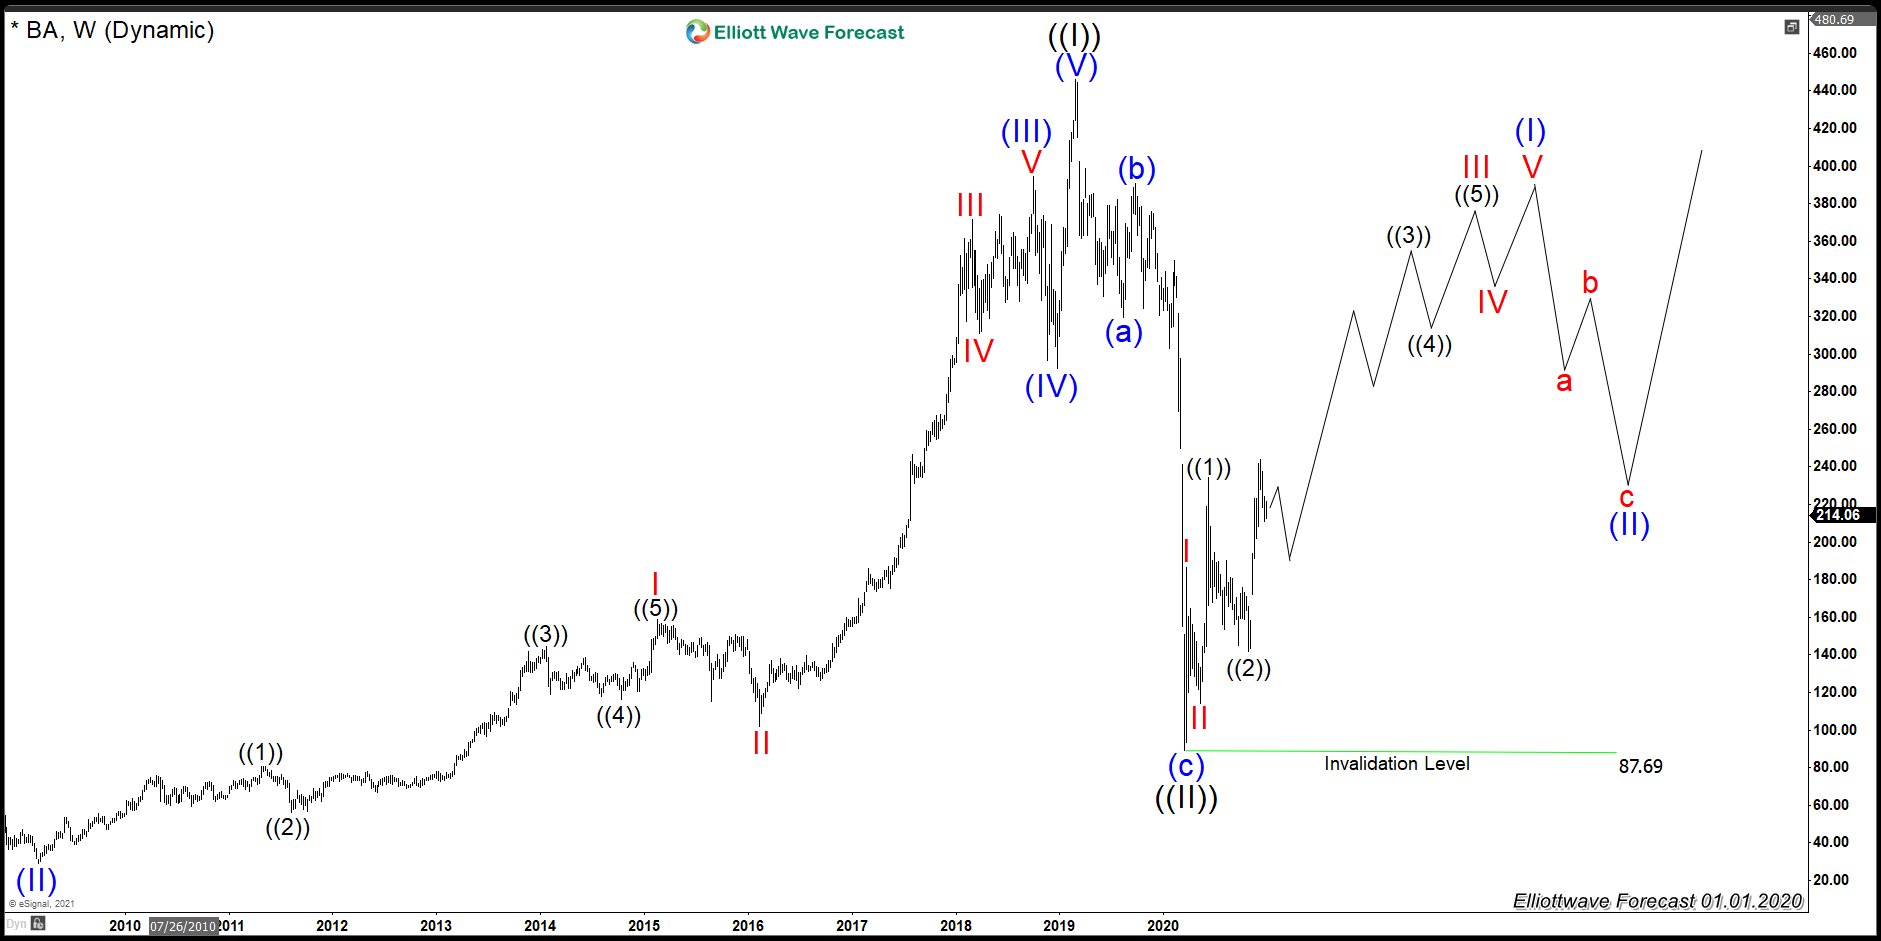
The chart above clearly shows five waves advances and three waves pullback to this year’s low. We see it very hard for the symbol to trade into seven swings higher and then make another low, even when it is possible. In reality, there is no more space to correct wave ((I)) with another leg lower. The market will dictate and, as always, the market is always right, but understanding the path is key.