Hello fellow traders. In this technical blog we’re going to take a quick look at the Elliott Wave charts of BABA Stock published in members area of the Elliottwave-Forecast.com . As our members know, BABA is showing incomplete sequences in the cycle from the December 2018 low (129.61). Break above 3rd May peak made higher high sequences in proposed cycle.We’ve been calling for further extension higher toward 213.02 + area. Recently we got 3 waves pull back , when the price reached Blue Box- Buyers zone. The stock found buyers there as we expected. In further text we’re going to explain Elliott Wave Forecast and trading strategy
BABA 1 Hour Elliott Wave Analysis 11.27.2019
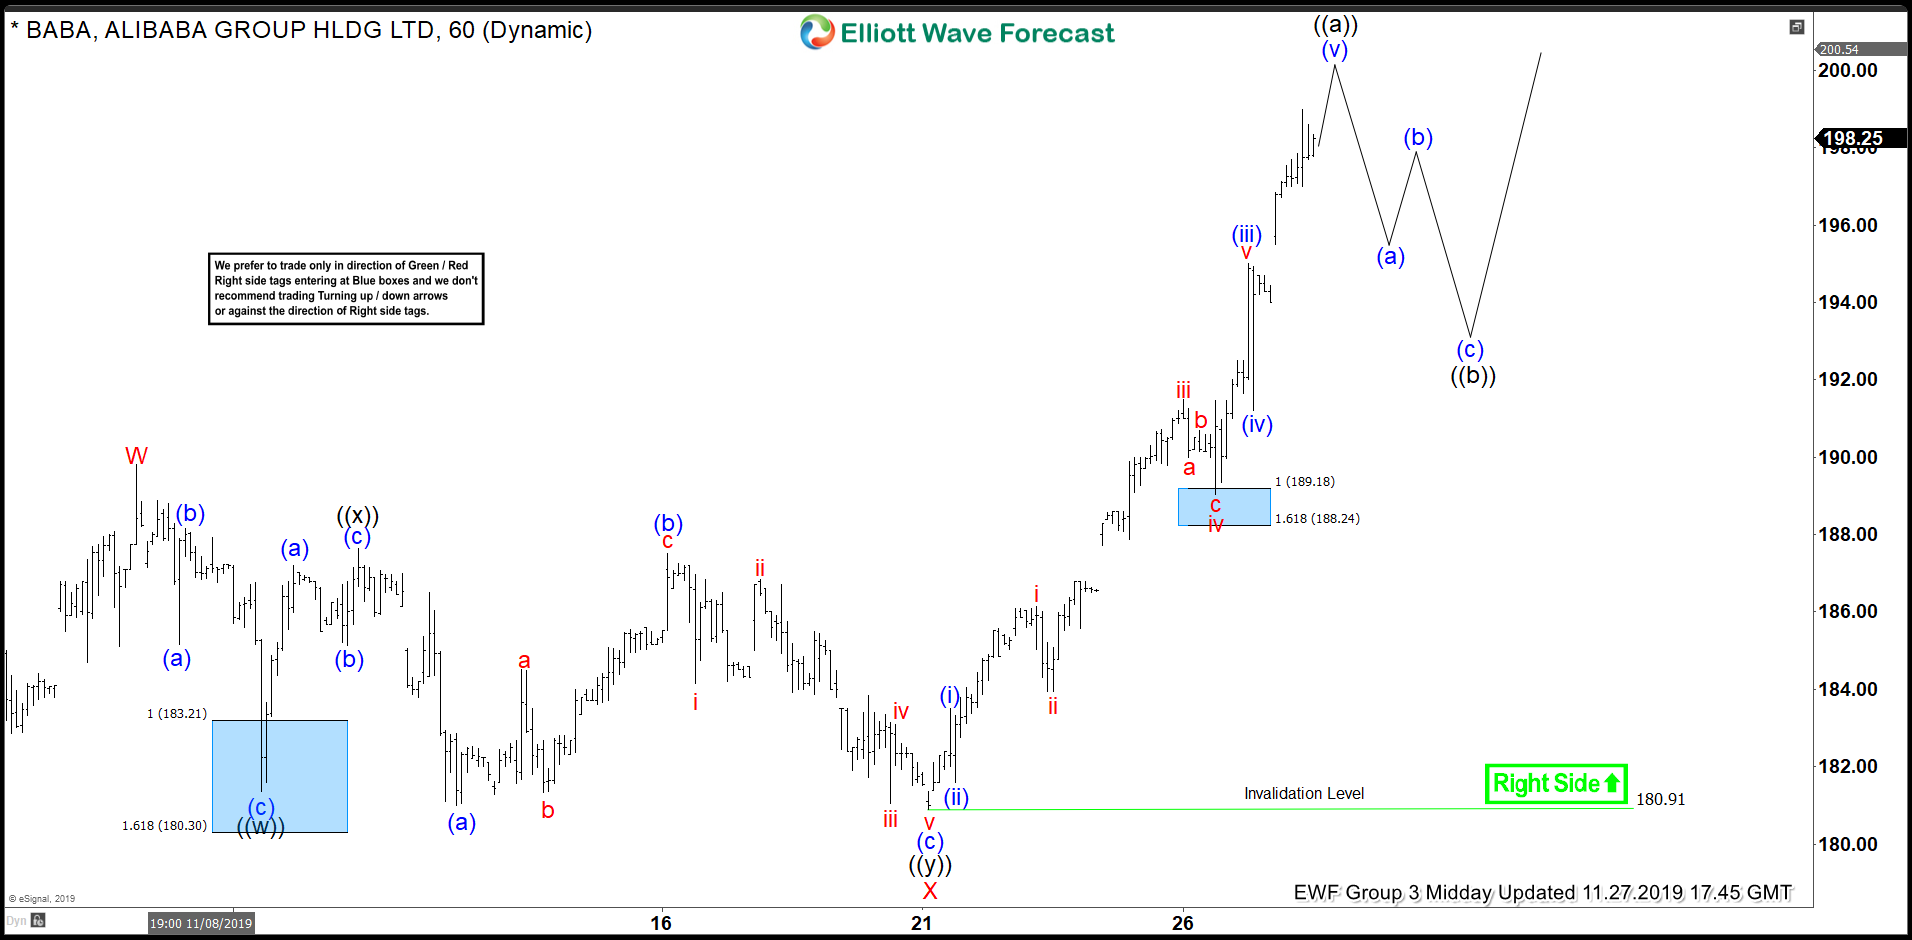
Current view suggests BABA is about to complete short term cycle from the 180.91 low as 5 waves rally. As far as pivot at the 180.91 low holds, we expect to see further strength in the Stock toward new highs. We expect to see 3 waves pull back ((b)) soon before proposed rally resumes.
BABA 1 Hour Elliott Wave Analysis 11.27.2019
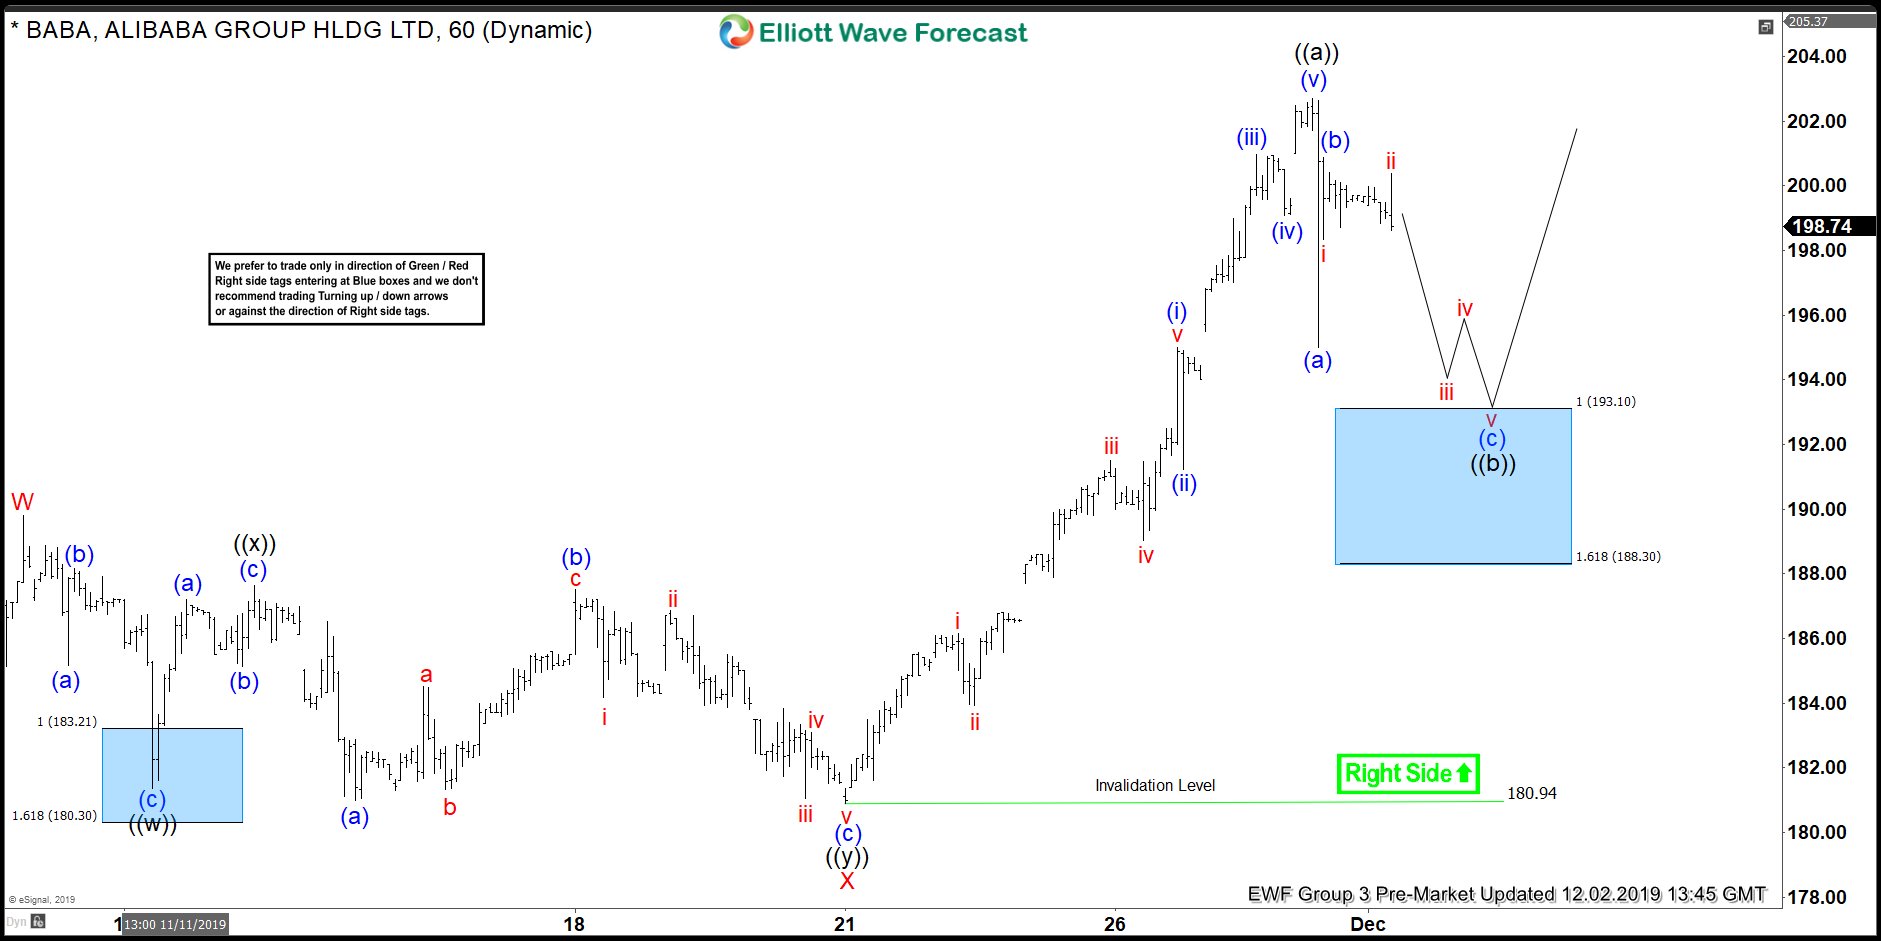
BABA ended short term cycle from the 180.94 low as 5 waves rally. Now we are getting wave ((b)) pull back against the mentioned low. Current view suggests the pull back is unfolding as Elliott Wave Zig Zag Pattern. Decline from the peak looks impulsive and we believe it was only the first leg (a) blue of wave ((b)) black pull back. We can get another leg down toward Blue Box area: 193.1-188.3. At that area we expect buyers to appear for proposed rally. Blue Boxes are no enemy areas , giving us 85% chance to get a bounce. The main trend is bullish and we expect to see reaction in 3 waves up from the blue box at least.
You can learn more about Elliott Wave Zig Zag Patterns at our Free Elliott Wave Educational Web Page.
BABA 1 Hour Elliott Wave Analysis 11.27.2019
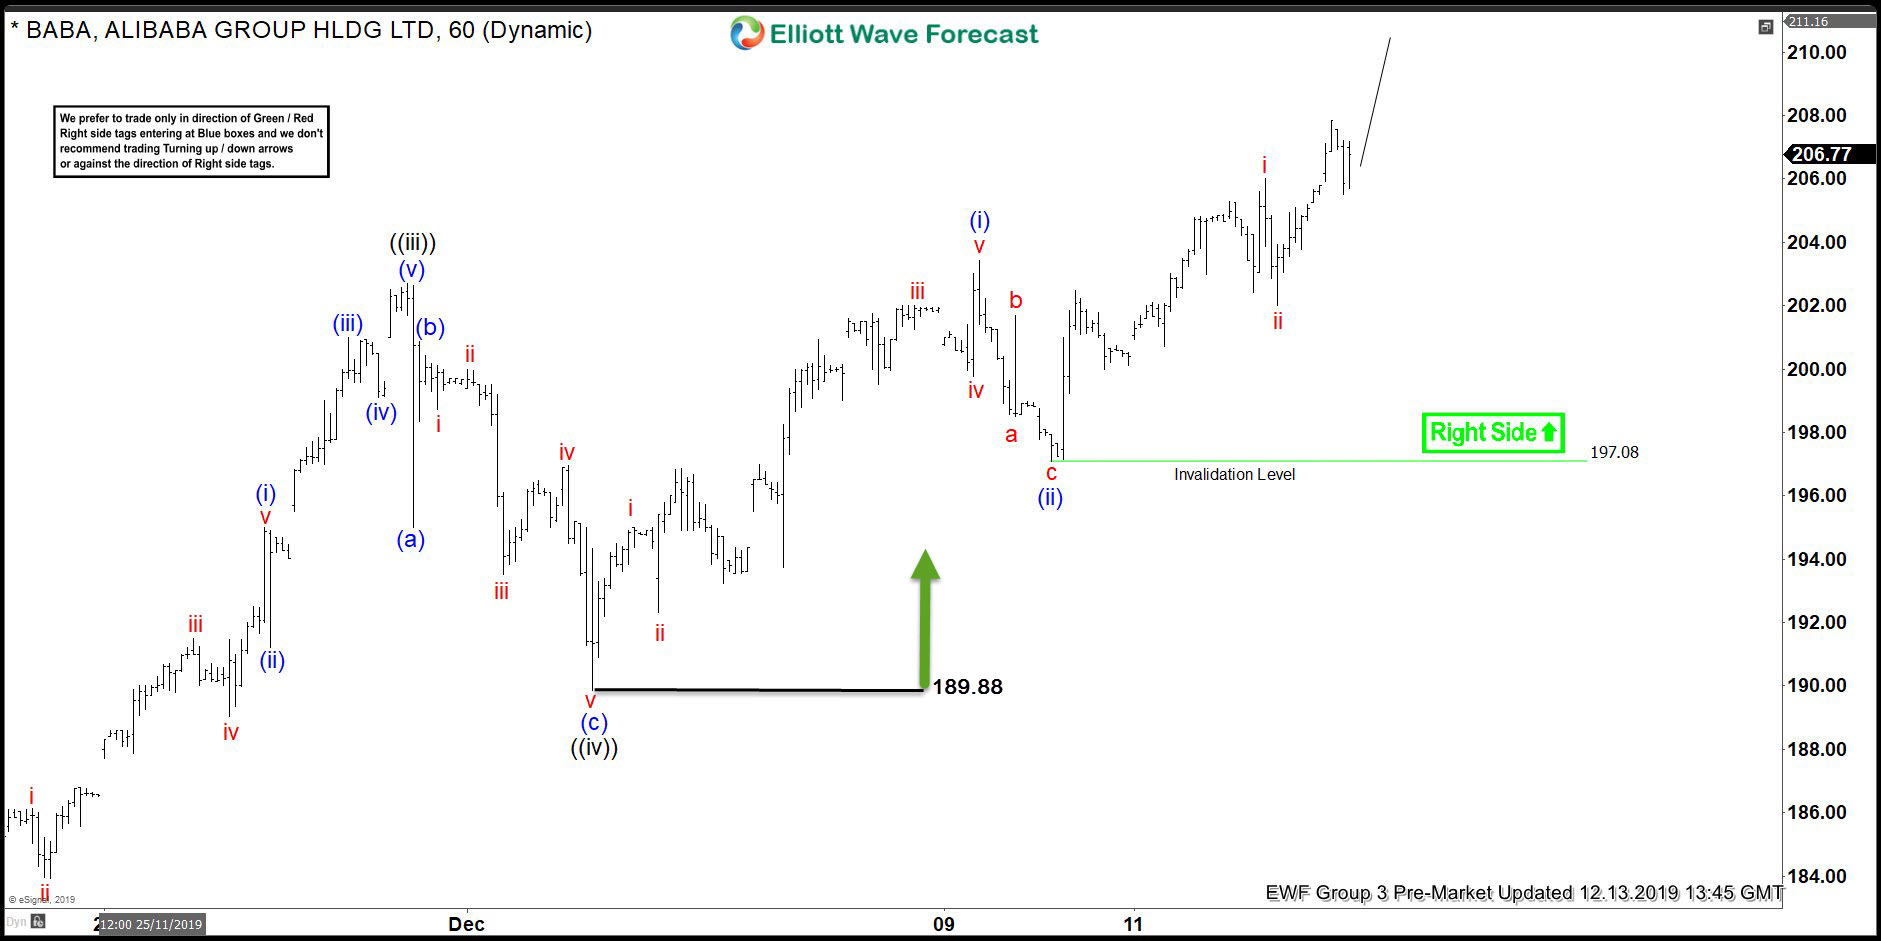
BABA found buyers right at the blue box area : 193.1-188.3 . The pull back completed at the 189.88 low as Elliott Wave Zig Zag. We got nice rally from there, when the price broke toward new highs. At this stage short term cycle from the 189.88 also looks incomplete , suggesting further extension higher. 0
Keep in mind market is dynamic and presented view could have changed in the mean time. You can check most recent charts in the membership area of the site. Best instruments to trade are those having incomplete bullish or bearish swings sequences.We put them in Sequence Report and best among them are shown in the Live Trading Room.