In this technical blog we’re going to take a quick look at the charts of Bank Of America (BAC) published in members area of the website. As our members know BAC made 5 waves down from the 36.04 peak ( 01/15). Proposed January cycle completed on March 23th date and the Stock made recovery. BAC made 3 waves against the 36.04 peak when the stock found sellers at Blue Box Area: 24.61-27.76 as we were expecting.
In the charts below, we’re going to explain the Elliott Wave structure and forecast.
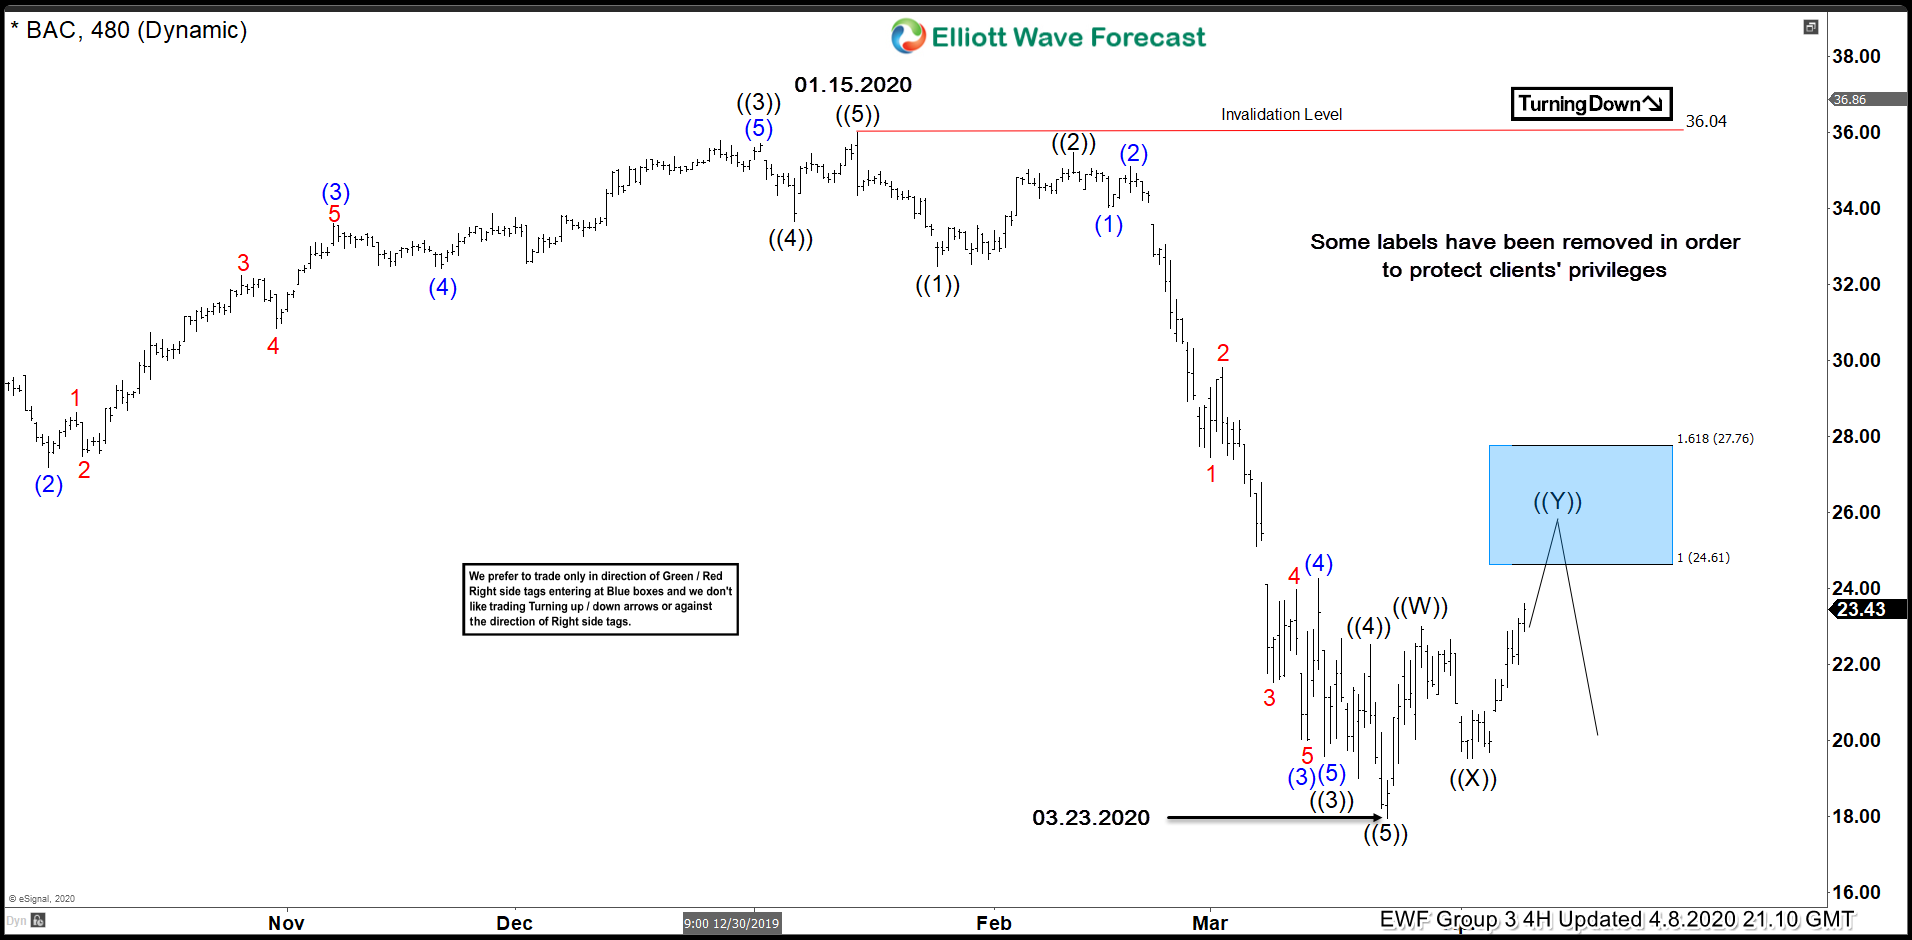
BAC Elliott Wave 4 Hour Chart 4.8.2020
Current view suggests The Stock is correcting the cycle from the 36.04 peak. At this moment correction looks incomplete. The price is showing higher high sequences from the March 23th low, missing equal legs at the moment. Consequently, we expect more short term strength toward 24.61-27.76 area. At the Blue Box area we expect sellers to appear for further decline toward new lows or 3 waves pull back at least. As our members know Blue Boxes are no enemy areas , giving us 85% chance to get a bounce. We get the Blue Box levels by using Fibonacci Expansion Tool and measuring Equal Legs - 1.618 Fib Extension .
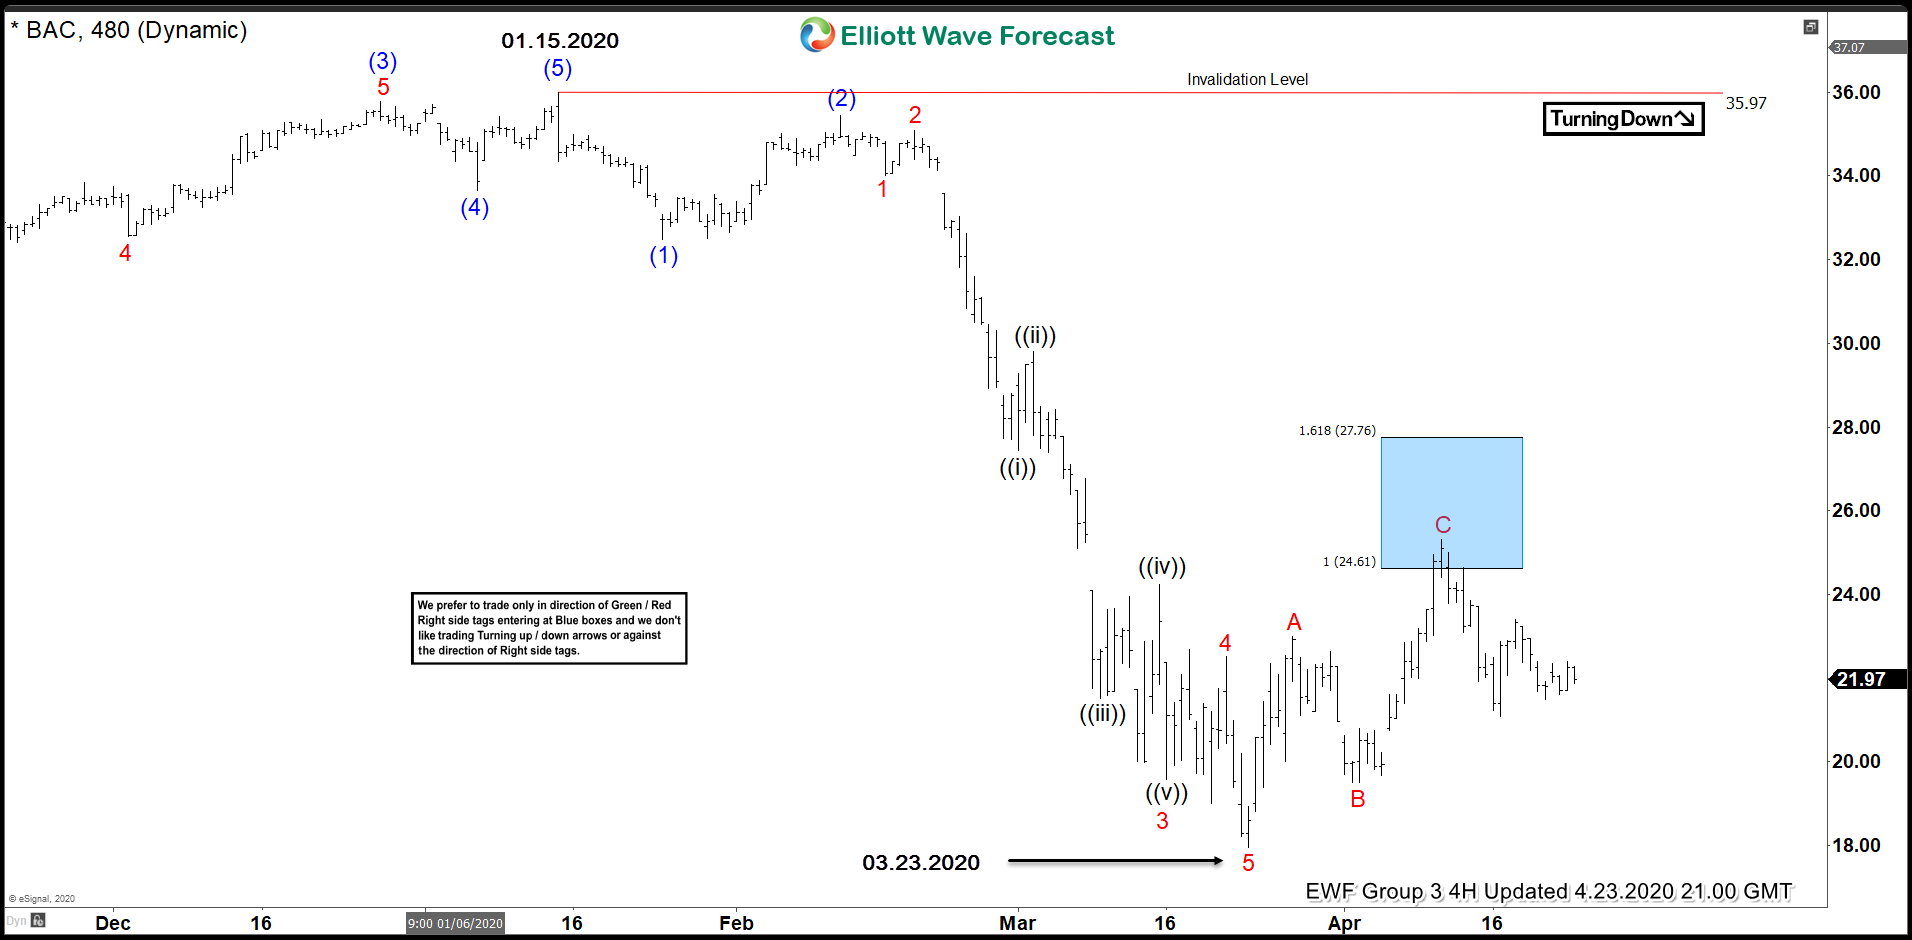
BAC Elliott Wave 4 Hour Chart 4.23.2020
BAC made proposed leg up toward blue box. The stock found sellers right at the blue box area : 24.61-27.76 and gave us decline from there as we were expecting. BAC ended clear 3 waves up from the March 23th lows. If the price breaks above 04.09 peak ( marked C red on the chart), it will open possibility of 7 swings up in the correction against the 35.97 peak. Otherwise it would need to break March 23th low in order to confirm next leg down is in progress.
Note: some labels have been removed in order to protect client’s privileges.
Elliott Wave Forecast