In this technical blog, we will look at the past performance of 4 hour Elliott Wave Charts of Bank of America stock ticker symbol: $BAC. In which, the rally from 23 March 2020 low unfolded as an impulse structure with an extended wave three. Therefore, we knew that the structure in BAC is incomplete to the upside & another push higher should happen to complete the 5 wave advance from March 2020 low. So, we advised members not to sell the stock & buy the dips in 3, 7, or 11 swings at the blue box areas. We will explain the structure & forecast below:
BAC 4 Hour Elliott Wave Chart
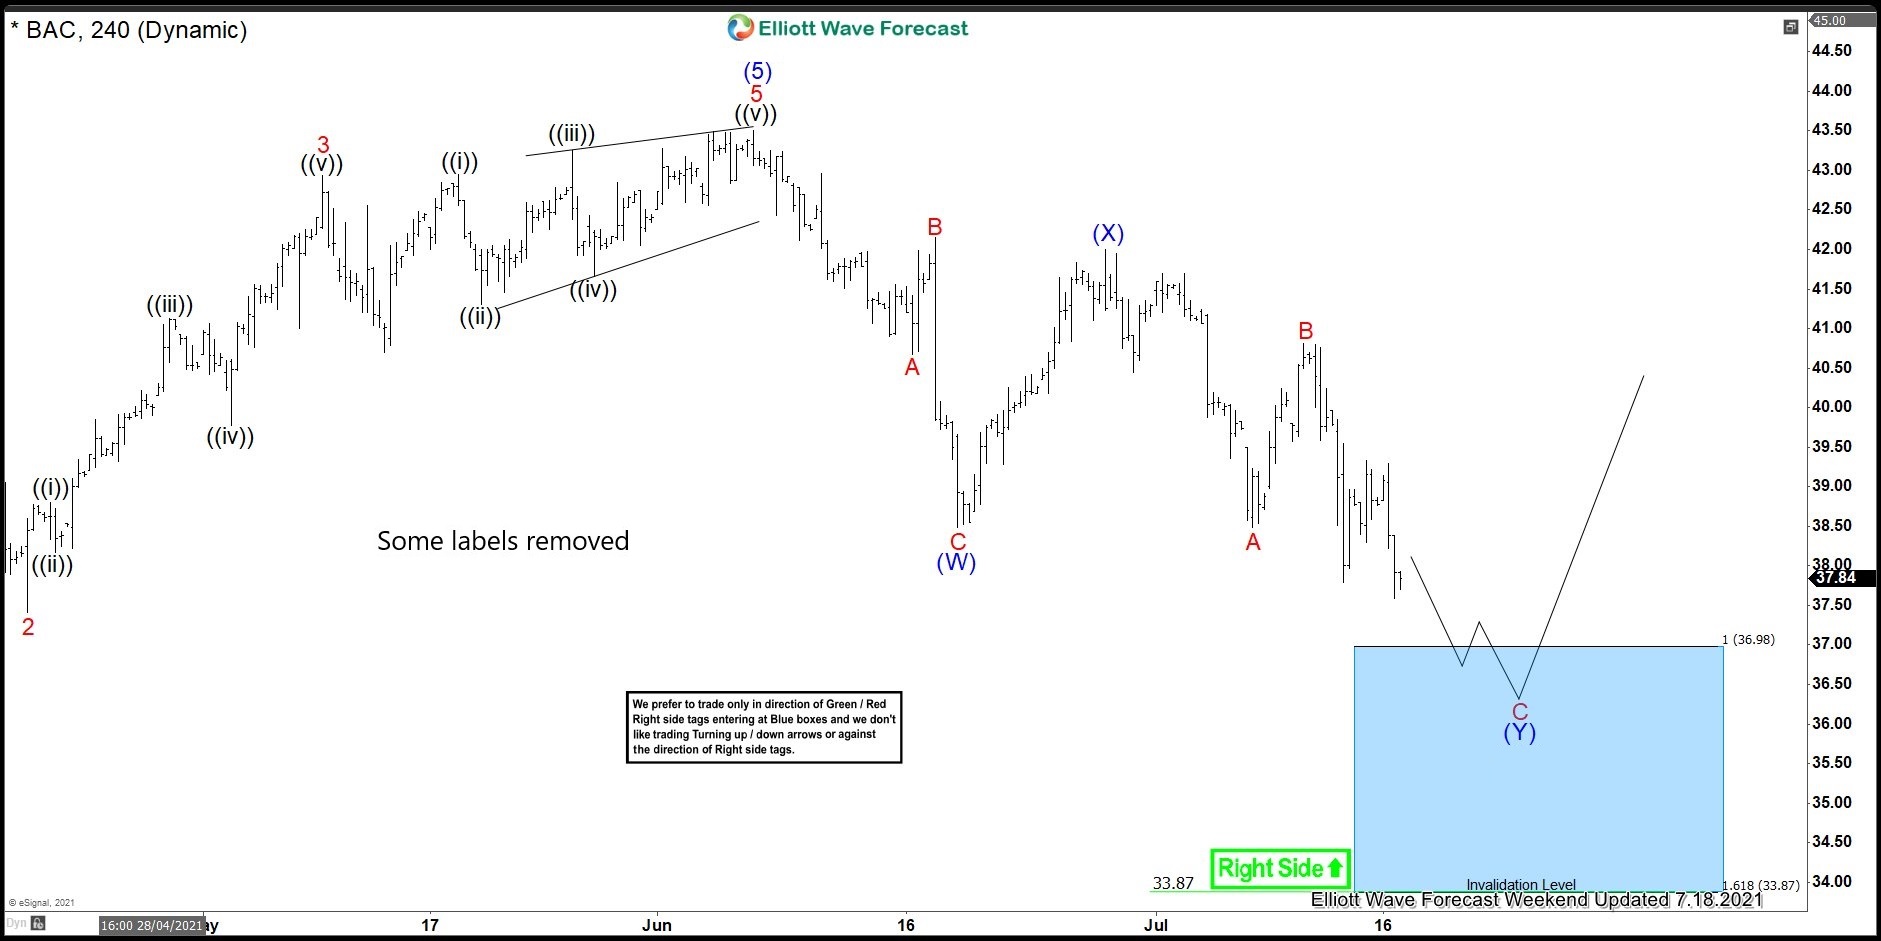
Here’s 4hr Elliott wave Chart from the 7/18/2021 Weekend update. In which, the cycle from 24 September 2020 low ended in 5 waves structure at $43.50 high & made a pullback lower. The internals of that pullback unfolded as Elliott wave double three structure where wave (W) ended in 3 swings at $38.49 low. Then a bounce to $42 high ended wave (X) & started the next leg lower in wave (Y) with a lesser degree zigzag structure towards $36.98- $33.87 blue box area. From where buyers were expected to appear looking for new highs ideally or for a 3 wave bounce minimum.
BAC Latest 4 Hour Elliott Wave Chart
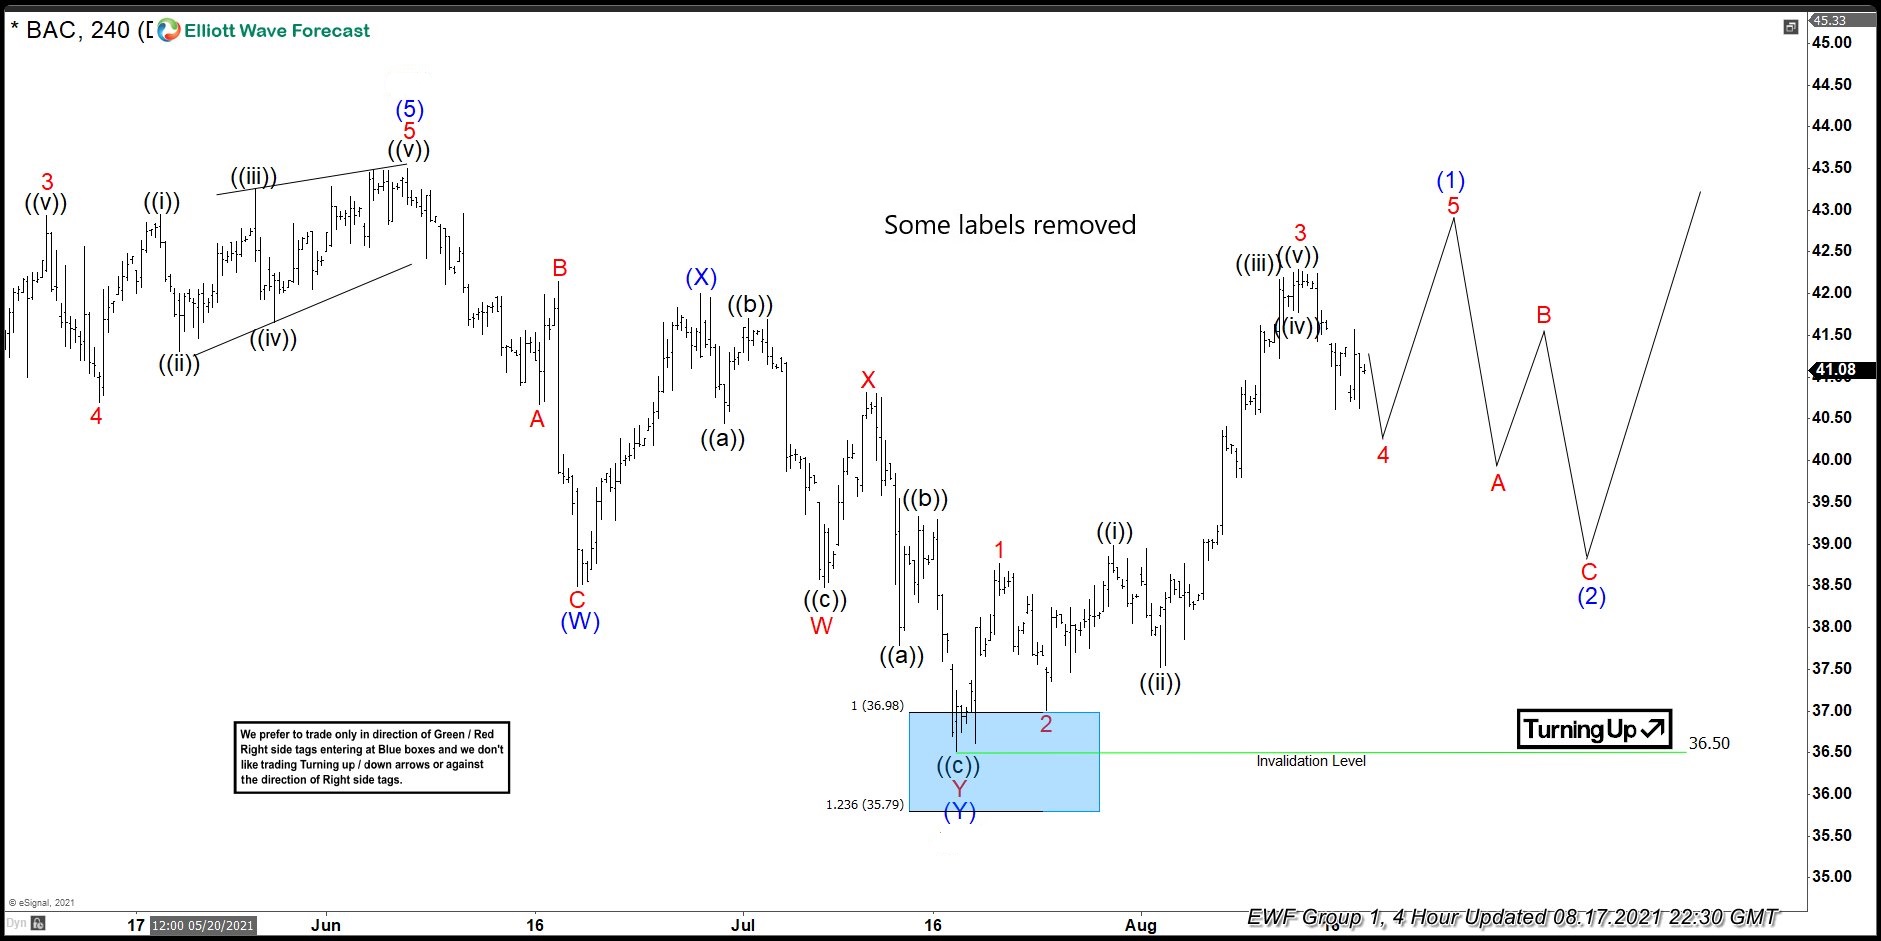
This is the latest 4hr Elliott wave Chart from the 8/17/2021 update. In which the stock is showing a strong reaction higher taking place from the blue box area at $36.98- $33.87. Right after ending the double three corrections within the blue box area. Allowed members to create a risk-free position shortly after taking the long positions at the blue box area.
Source: BAC Reacting Strongly From Elliott Wave Blue Box Area