Bayer Ag is one of the largest pharmaceutical companies in the world. Founded in 1863 and headquartered in Leverkusen, Germany, Bayer’s most famous product was aspirin. Today, the company is a part of DAX30 and of SX5E indices. In recent weeks, as all major pharmaceutical companies, Bayer contributes also actively in the fight against COVID-19. If that action will help the stock price to recover?
Bayer Monthly Elliott Wave Analysis 04.26.2020
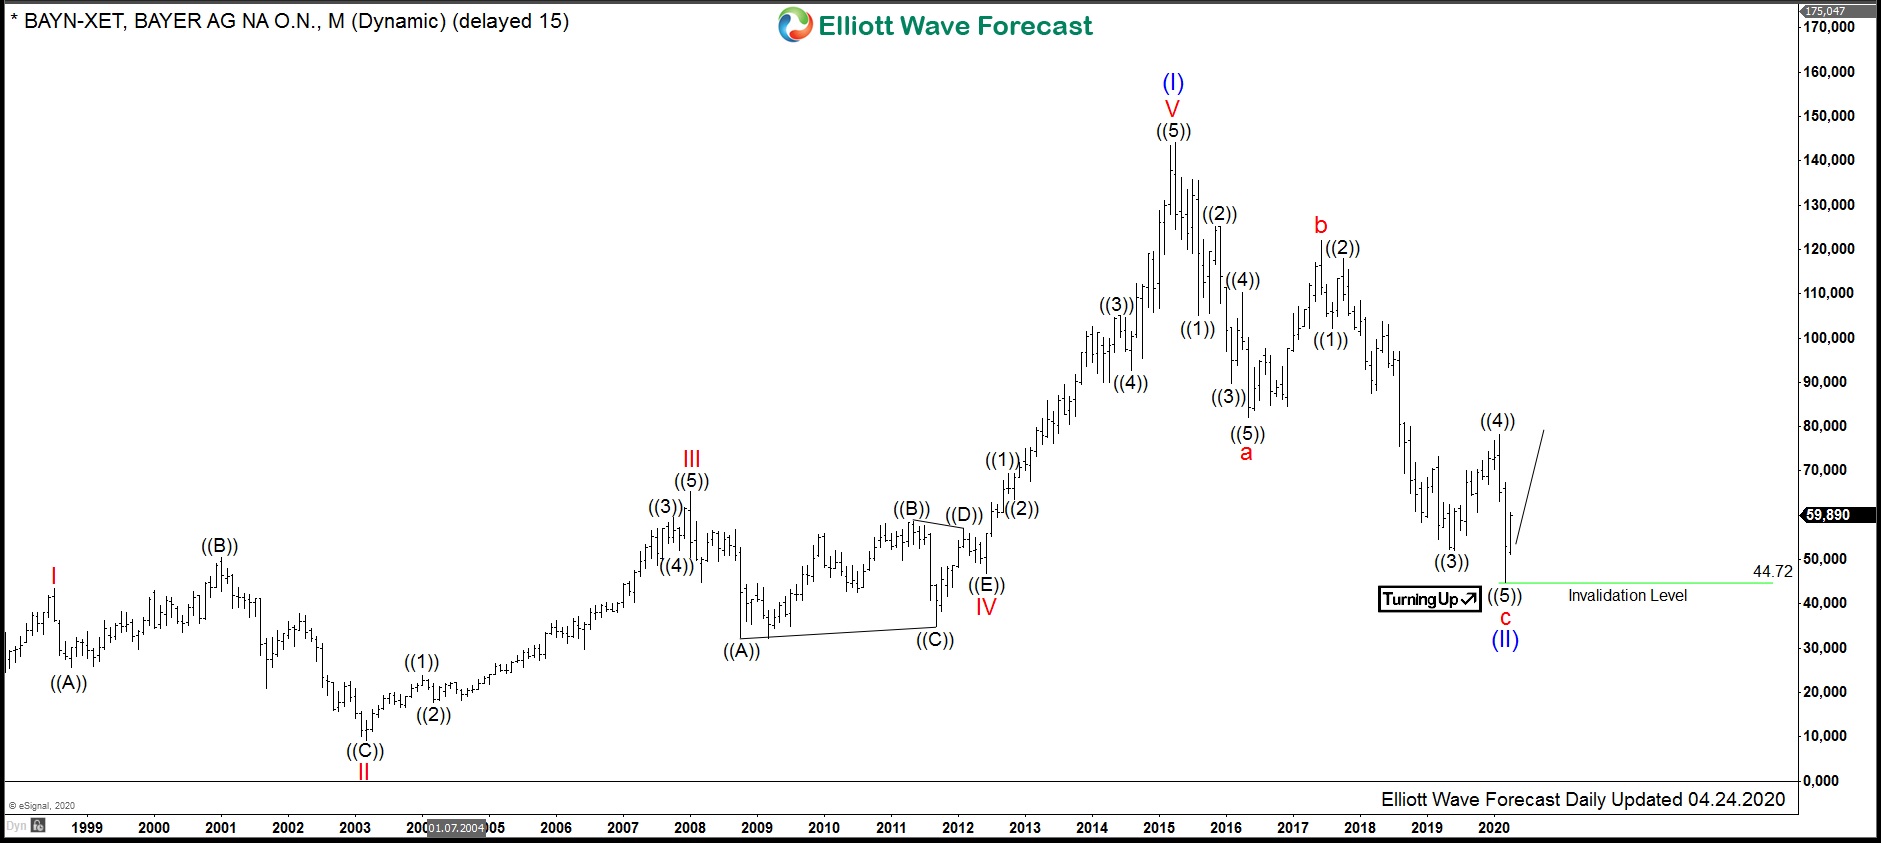
The monthly chart below shows the Bayer stock $BAYN traded at XETRA. From all-time lows, the stock price has developed an Elliott wave motive wave pattern. The cycle up in blue wave (I) being of super cycle degree has ended by printing its top at all-time highs on April 2015 at 144.13. Within the super cycle in wave (I), the red waves I, III and V of cycle degree are also motive waves. Wave II is an expanded flat and wave IV is an Elliott Wave triangle pattern. Even though the internals of wave IV are falling below 43.55, hence, an overlap occurs with the price territory of the wave I. Nevertheless, the end of the wave IV in subwave ((E)) is proposed ended at 46.95, therefore, no crossing of waves I and IV takes place.
The triangle in wave IV has resolved in a thrust higher in wave V. Within the super cycle, it is the 5th wave extension which we can see in the monthly chart. Finally, RSI divergence between wave V and wave III is a sign of the cycle maturity. As a general rule, 5 waves up require a correction in 3 waves lower. Once the consolidation is over, only then the trend up can resume.
Bayer Weekly Elliott Wave Analysis 04.26.2020
The correction of the super cycle higher in wave (I) from the 04.2015 highs in blue wave (II) lower is shown in detail in the weekly chart below. The decline has unfolded so far as a zigzag pattern, i.e., a 5-3-5 structure. The cycle in red wave a has ended on 05.2016. The decline shows five subwaves with the overlapping waves ((1)) and ((4)) which might be a leading diagonal. The correction higher in red wave b has printed its top on 06.2017. From there, another leg lower in red wave c is demonstrating an impulsive character. The wave ((3)) shows an extension which in turn has an extended 3rd subwave, i.e., blue (3).
Now, the wave ((3)) of c has ended at 52.00 reaching the equal legs extension area of 1.0-1.618 multiple of the length of the wave a (s. blue box area). The bounce from the blue box to the 78.25 level is sharp and broke the RSI channel to the upside. However, the price has retraced less than 50% of the wave ((3)) and has respected the price action resistance line. These features together with incomplete look of the decline from the 06,2017 highs favor counting the rise and the subsequent fall to new lows as the waves ((4)) and ((5)) of the cycle lower in wave c.

Bayer Daily Elliott Wave Analysis 04.26.2020 and Outlook
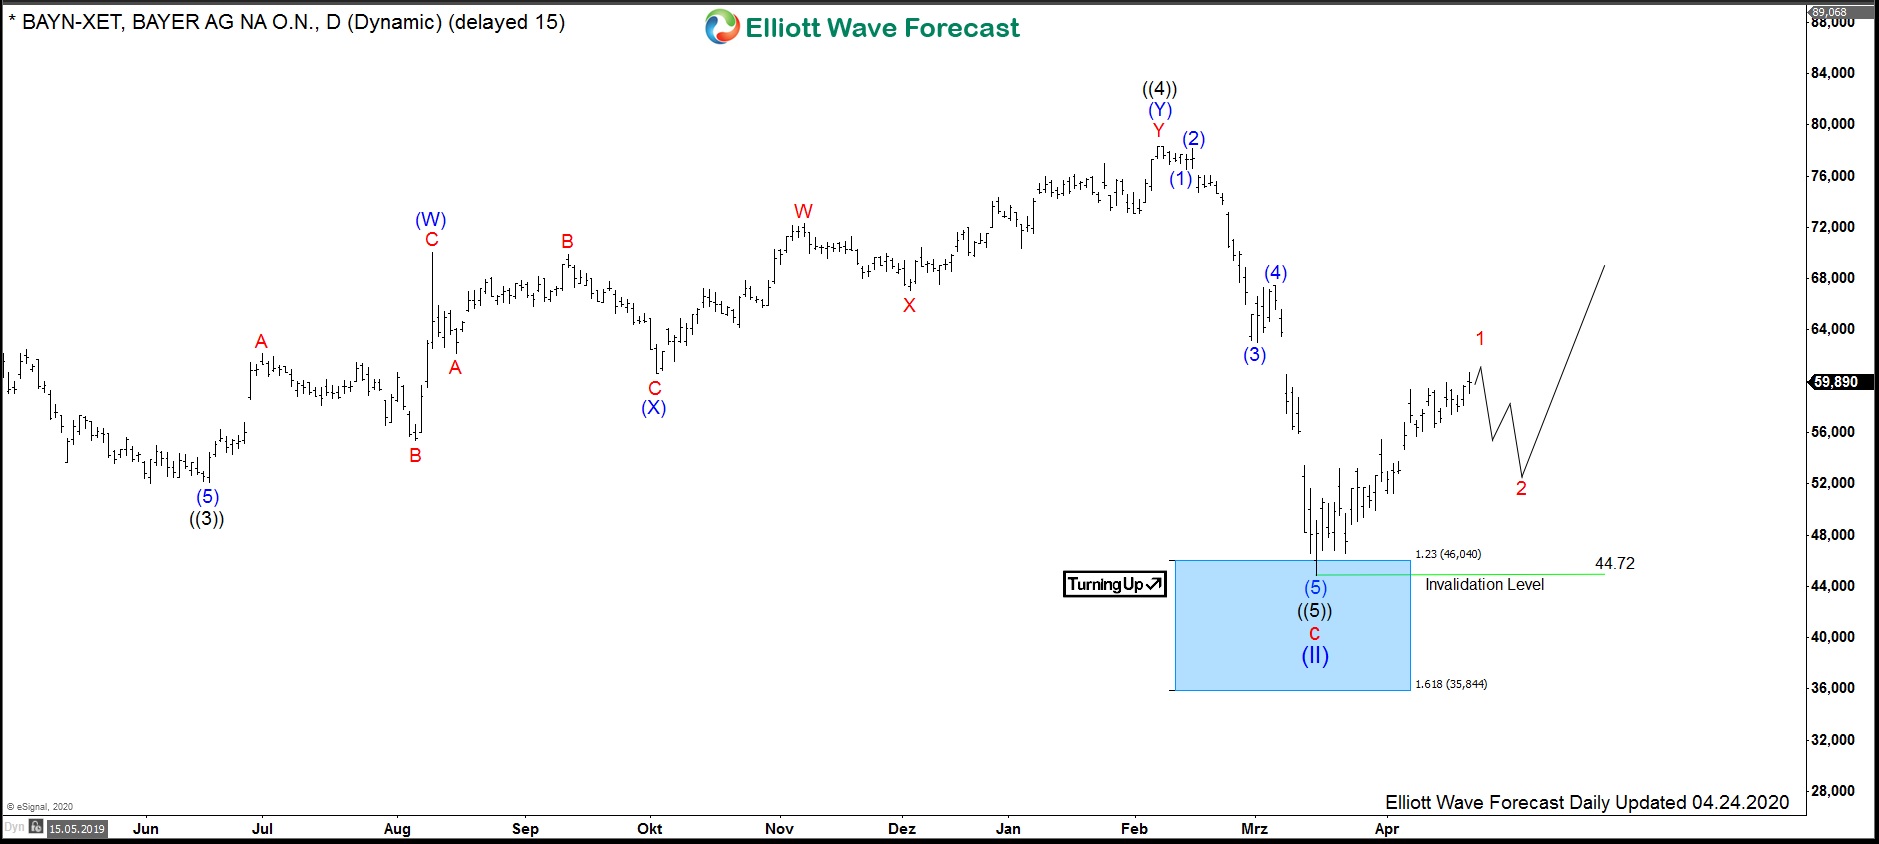
The daily chart below shows in more detail the sharp fall towards 44.72 on March 2020. There, the stock price has found a bottom within the weekly blue box extension area. Moreover, it has reached the 1.23-1.618 inverse extension of the wave ((4)). From the March lows, the price has bounced breaking both price and RSI channels of the decline in wave ((5)) of c. Therefore, the correction in wave (II) from the 04.2015 highs might be over. While above 44.72, the price of $BAYN should find support. The stock price could be starting right now to a new multi-year rally in the wave ((III)) towards 144.13 and higher or should bounce in 3 waves at least.