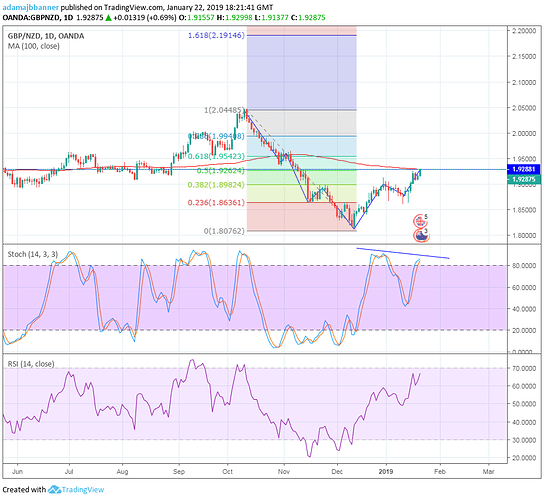
I’m relatively new to trading and I’m only just starting to try out technical analysis, I’ve seen that this pattern here resembling an Elliot wave as well as the corrective wave being near the 50% fib retracement and a 100 moving average, also a possible divergence on the stochastic indicator
Just wondering how, if I were to trade it, go about entering, should I wait for a bounce?
