Since the crash of March 2020, all stocks have tried to recover what they lost, and Berkshire Hathaway was no exception. BRK.B did not only recover the lost, but It also reached historic highs. Now, it is building an impulse from March 2020 lows with a target to $318 - $342 area. Target measured from wave ((1)) and wave ((2)). We think this target is conservative and as the weeks go by, we will update a better target area.
Berkshire Hathaway Old Daily Chart
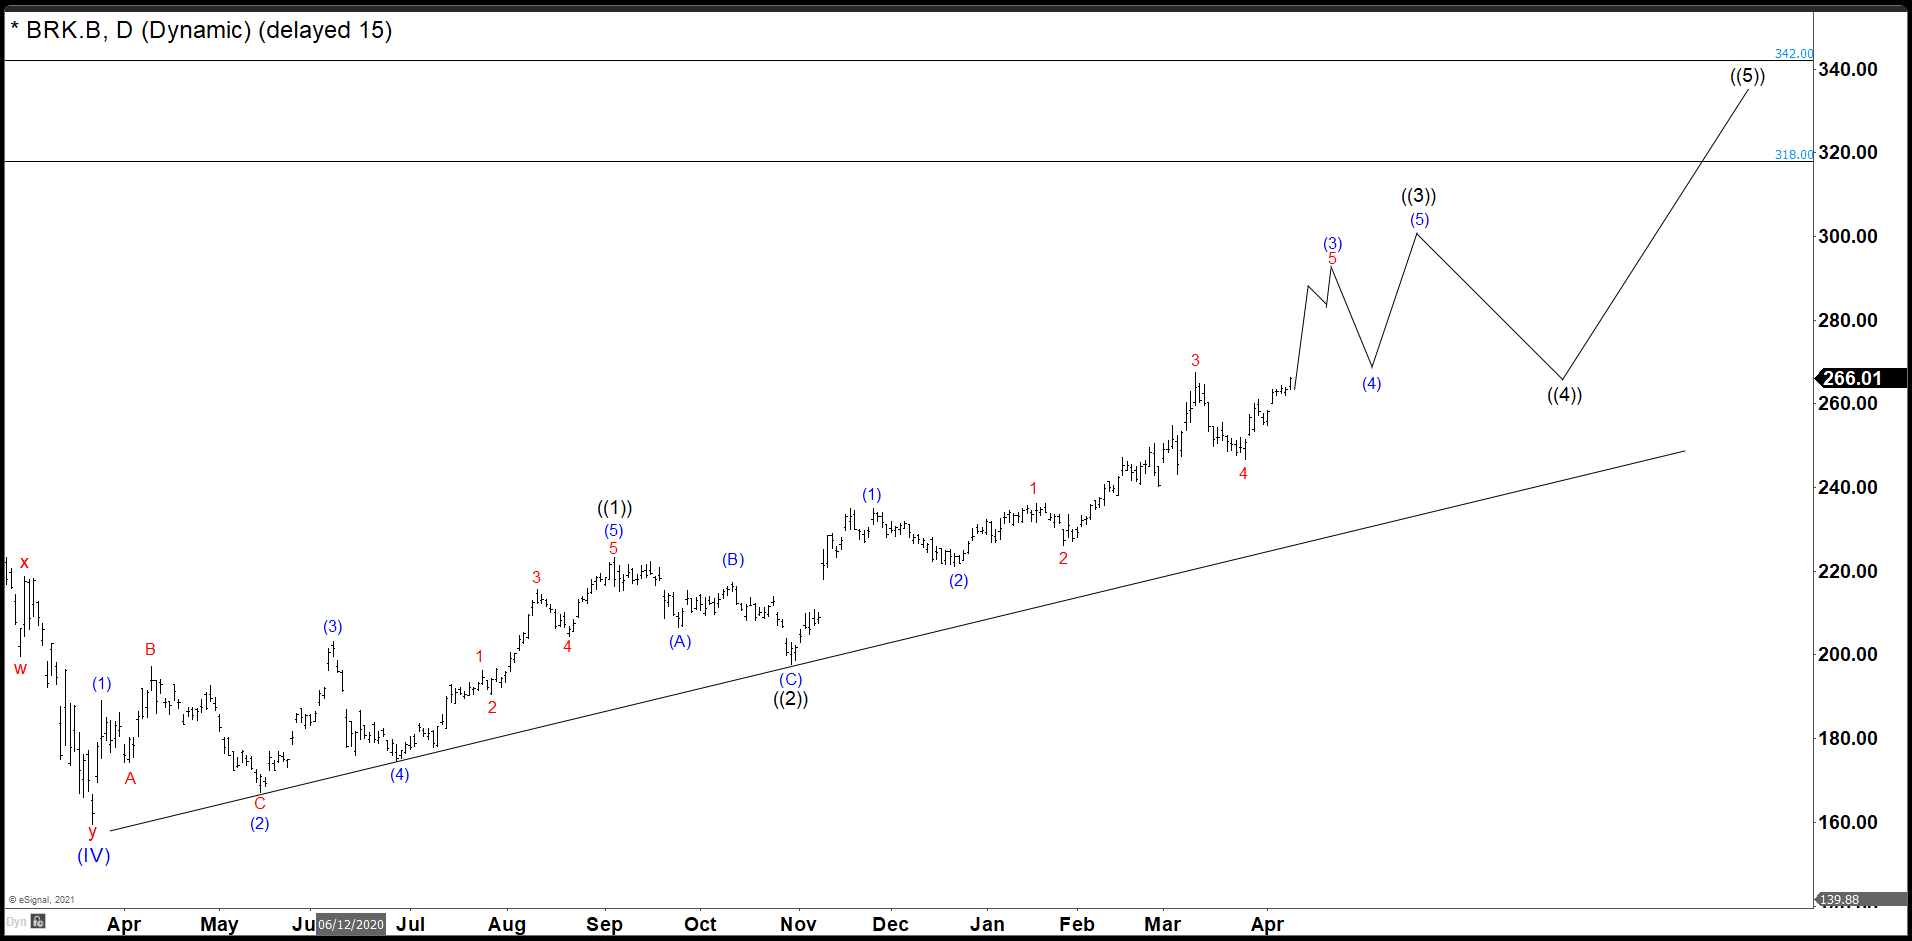 As we see in the daily chart, the wave ((1)) has ended, the structure could be rare for you because it is not quite common, and it is called an expanding leading diagonal. (If you want to learn more about Elliott Wave Theory, please follow this link: Elliott Wave Theory). I think it is better to manage the structure of Berkshire Hathaway in that way instead of a nest, and this is because comparing some cycles in the market has more sense with the current structures of the market. Then we have a clear (A), (B), © correction as wave ((2)) and we are developing wave ((3)) in this moment,.
Berkshire Hathaway Daily Chart
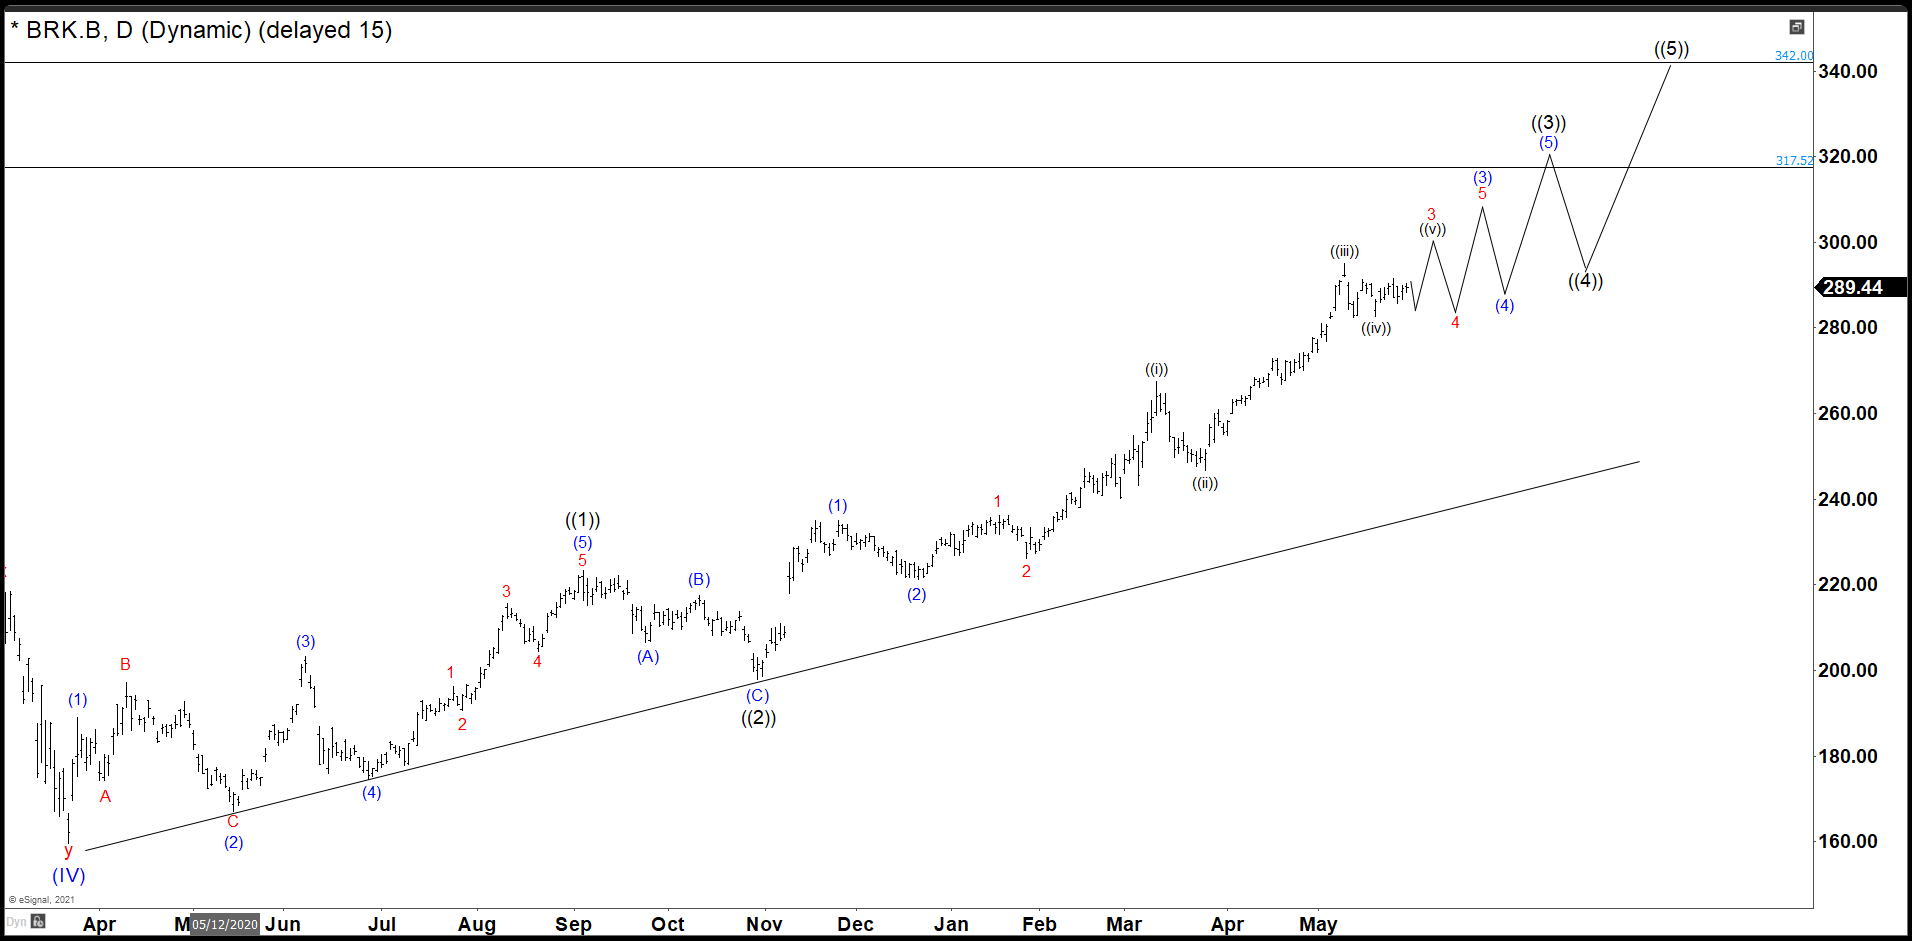
In Berkshire Hathaway, we have added another nest as waves ((i)) and ((ii)). That means we are expecting 4 peaks more to complete the cycle. In the old chart, we were expecting 3 peaks more only. It does not mean that the old chart is wrong, to add a new nest gives the current structure more Harmoniousness. We go taking decisions as the market advances.
Short Term wave ((iv)) possibly ended, but we cannot rule out one more swing lower before continue to the upside. We will confirm wave ((iv) when we break the wave ((iii)) high to look for complete wave 3 in red. In the next months we should continue higher in the stock as a ranging mode following the uptrend as we could see in the chart.
Source: Berkshire Hathaway Inc. Followed The Path Entering in a Ranging Zone