The Borsa İstanbul (BIST or XU100) is the sole exchange entity of Turkey combining the former Istanbul Stock Exchange (ISE), the Istanbul Gold Exchange and the Derivatives Exchange of Turkey under one umbrella. It was established as an incorporated company with a founding capital of ₺423,234,000 (approx. US$240 million) on 2013 and began to operate on April 5, 2013. Its logo is the traditional Ottoman mark for Istanbul, the tulip. Its slogan is worth investing.
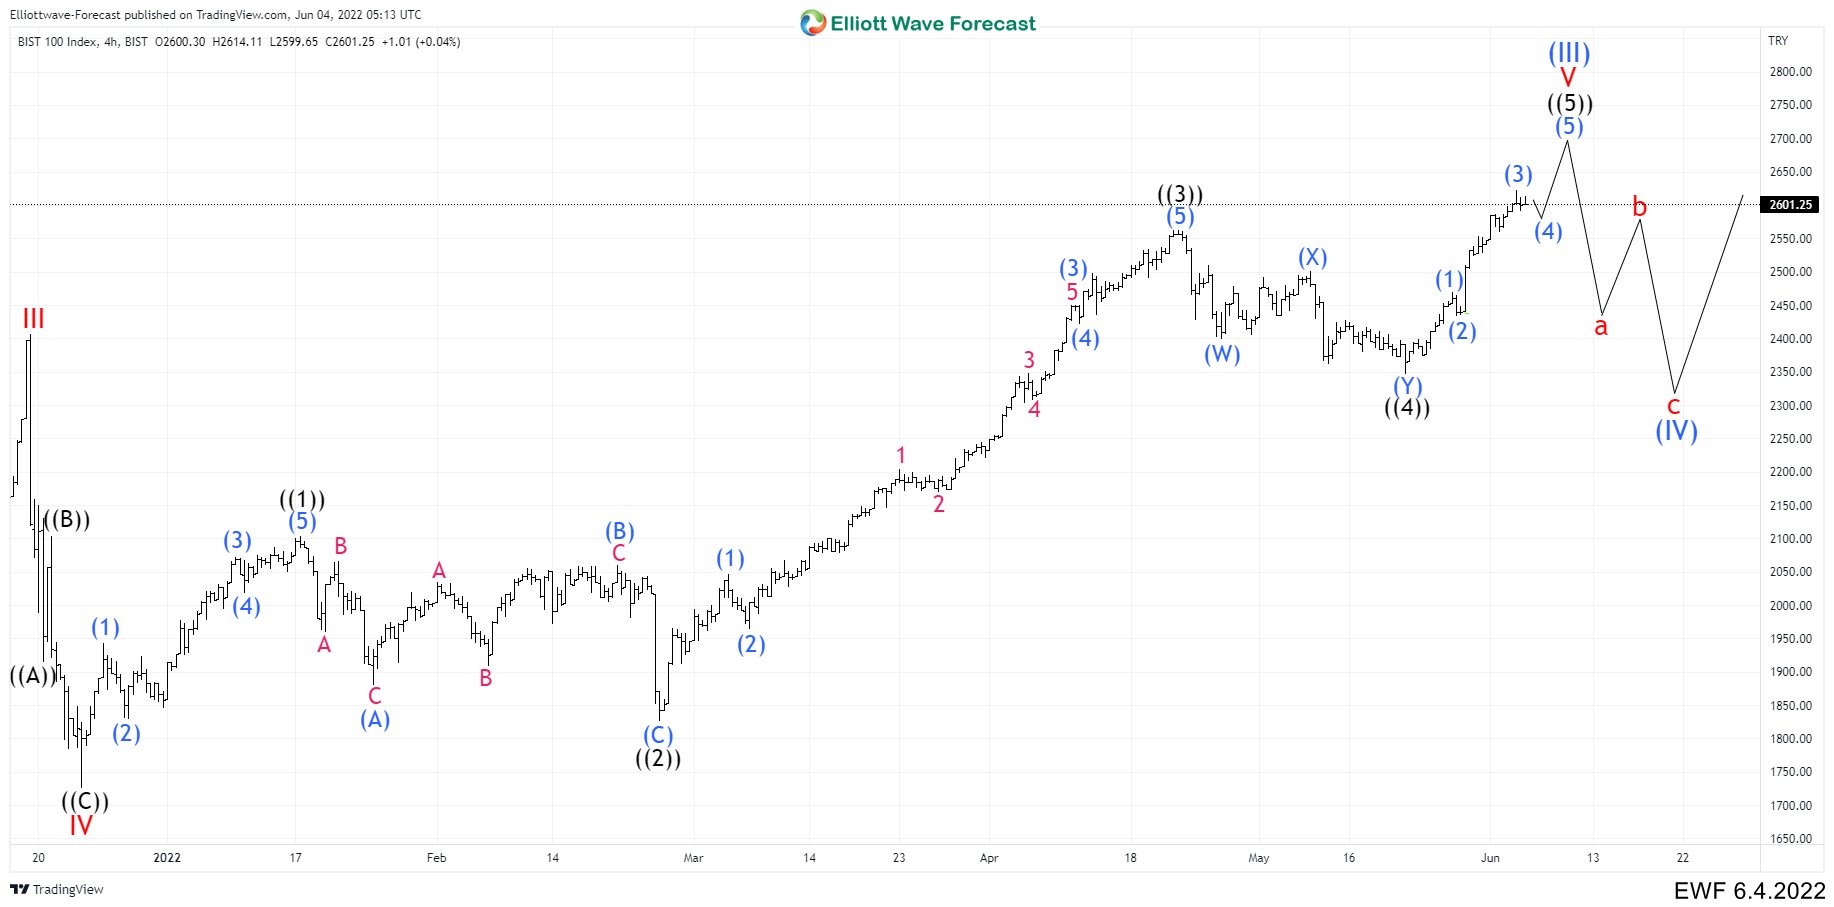
XU100 4 HOUR CHART JUNE 4th 2022
The XU100 started a rally from the end of December 2021. While other stock indices around the world have had a negative year so far; for example, the SPX has lost 13.80%, the BIST 100 has gained 40.00%. As we see on the chart, the rally that started from wave IV at 1727 shows a 5-wave structure, forming an impulse according to the Elliott wave theory. Wave ((1)) ended in 2105. The corrective wave ((2)) did a flat structure (A), (B) and (C) ending in 1826.
Then continued a strong rally to build wave ((3)). In a lesser degree, we have wave (1) ended at 2047. Wave (2) at 1963. The bullish momentum followed with wave (3) extending to 2450. Wave (4) pulling back at 2421. And the last bullish push completed wave (5) and wave ((3)) at 2562. In mid-April, we started the correction of wave ((4)), ending after a month at 2346 forming a double correction. From this level, we are looking for another five waves to complete the cycle that started last year. So far the structure has 3 waves and we need 2 more to complete the impulse wave ((5)) and finish wave V and (III) in a higher degree. If there are not extensions in this latest wave, it should end around 2690, where we should see a pullback in 3, 7 or 11 swings to build a wave (IV) before continuing higher.
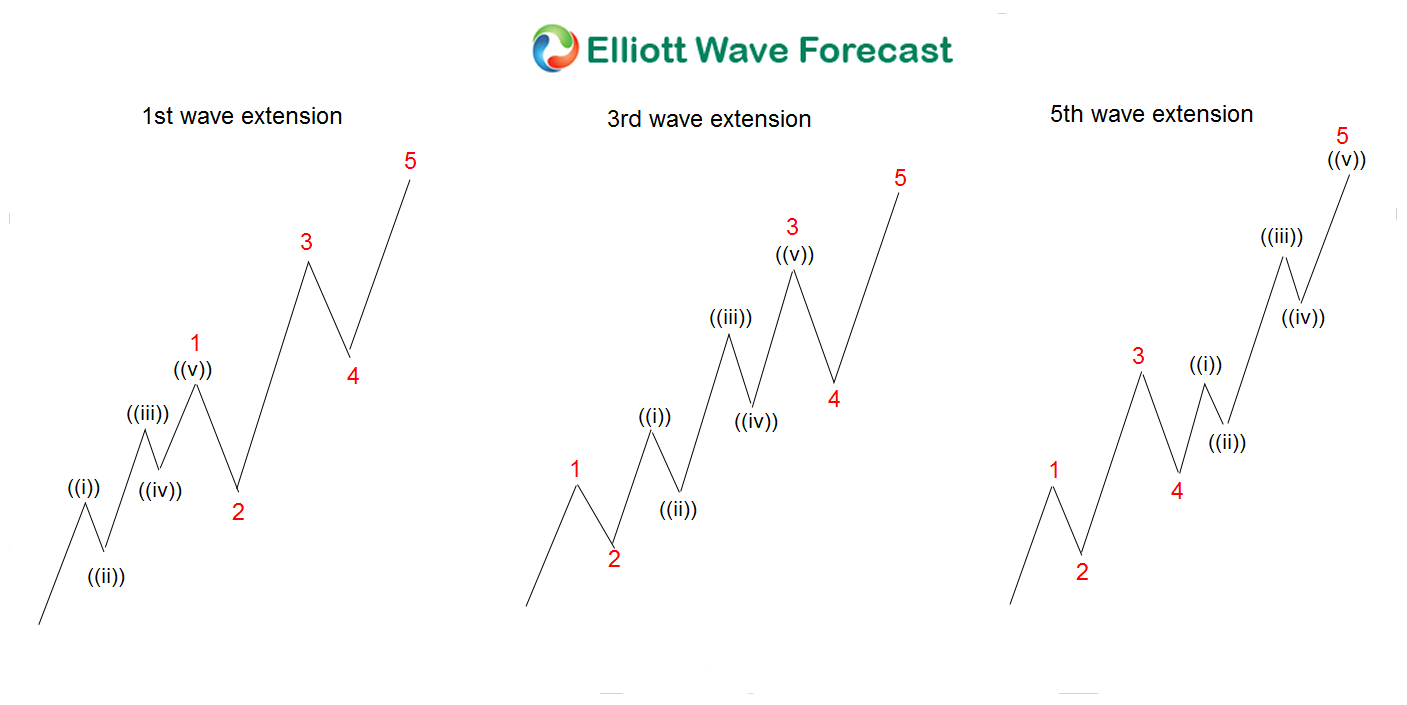
Wave ((5)) Extension
On the chart, we can see the different extensions that an impulse can have. You could even have all 3 extensions in one push. Regarding XU100 we already have an extension in wave ((3)), but it could be the case that there is another one in wave ((5)). (If you want to learn more about Elliott Wave Theory, follow these links: Elliott Wave Education and Elliott Wave Theory).
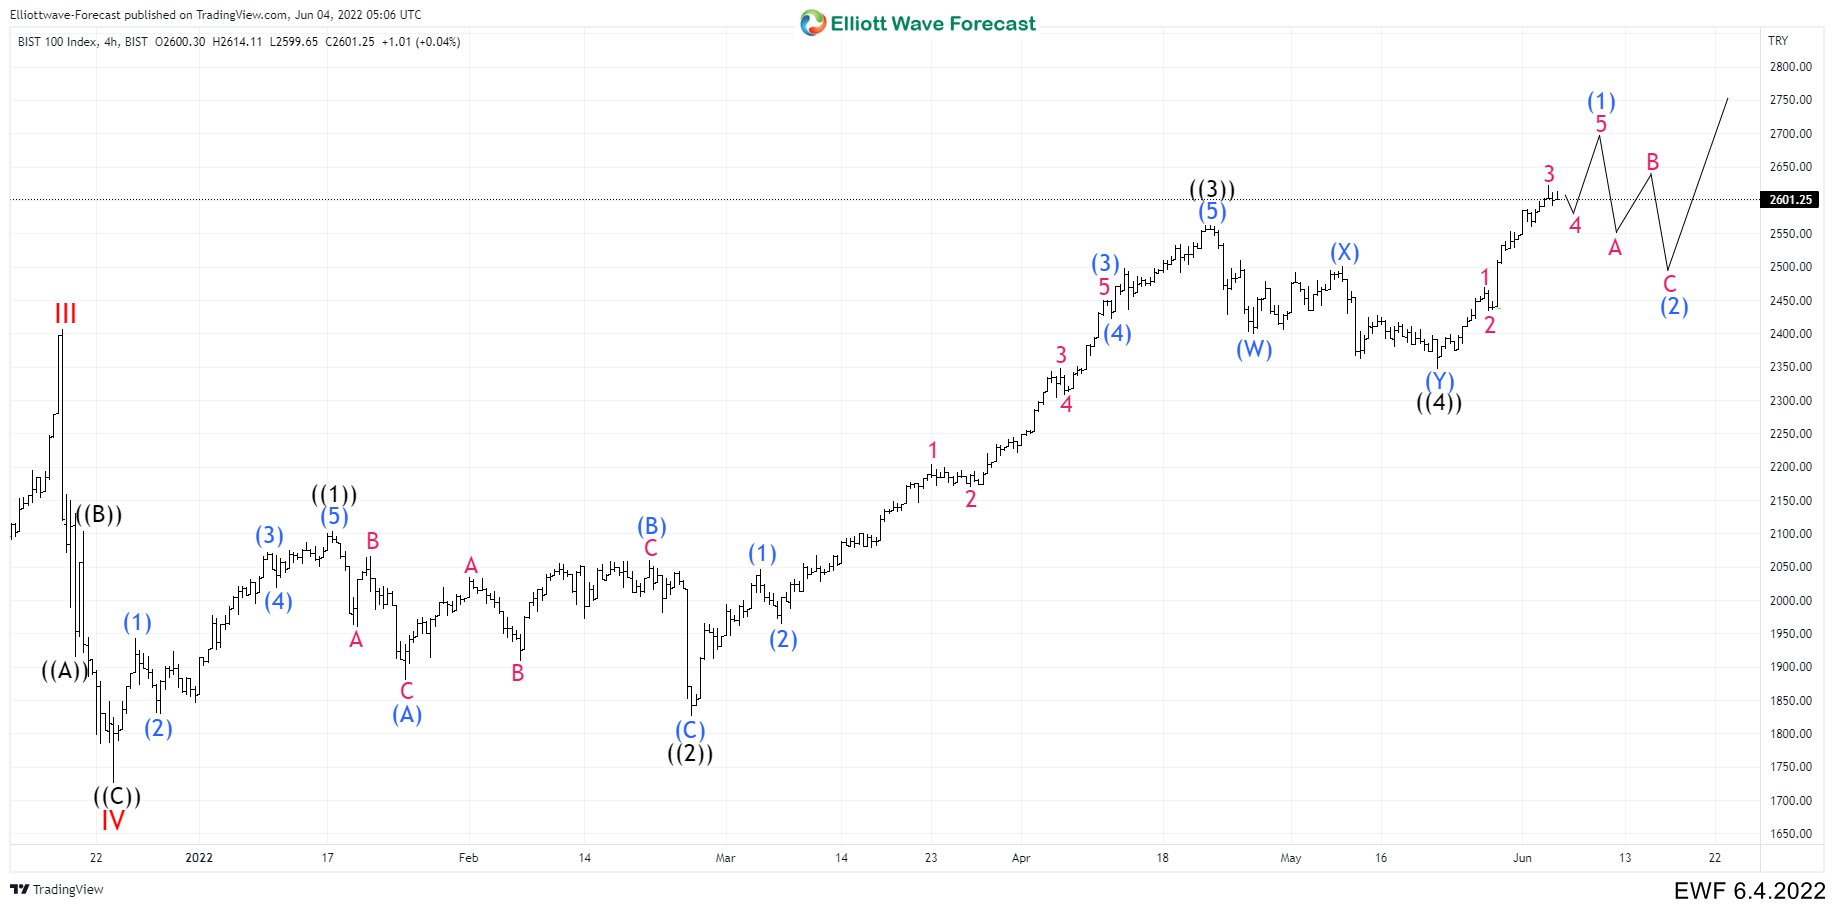
XU100 4 HOUR CHART JUNE 4th 2022 Alternative
As we can see in this chart, by reaching around 2690 level, we are not completing wave ((5)), but rather wave (1) of ((5)) of a lesser degree. This extension would make the correction not as deep as we saw in wave (IV) of the previous chart, but it would be a shorter correction like wave (2) to then continue with the rally.


