Well last time i looked at bitcoin i was looking for a similar price action to happen in the yellow box to the previous section, low and behold we got similar price action. price came down to support and we got the push up. If you followed that was an easy intraday trade. Currently we see price sat at the top of this range, we need to breakout of here to see further move to the upside. We are creating higher lows, we just need to create that next higher high. Moving averages are giving nice dynamic support, looks to be a wedge formation so i think its only a matter of time before we see a breakout to the upside. get ready on any pullbacks to buy in. GLIYF

4 Likes
ah nice one! BTC doing alright eh! made a wee profit over the weekend myself on btc usd long 
1 Like
Knocking on the door again. One of these days it’ll go through it and close it behind
Bitcoin has been trading inside this mini range for a few days now. Its quite clear the bull is strong currently. Once the moving averages catch up with time then we will see the next push. but which way will it go? Ideally we all want it to go up, especially the HODLERS. My ideal scenario is for it to range across to where it meets the trend and picks up support from that, the moving average and the Fib level, that would give it 3 good confluences for a strong push. Lets wait and see. GLIYF

Looking back at Bitcoin again today and we can see price has give us a push down from the resistance level . Nothing major as we expected a drop before we get the next push upwards. As you can see it rejected just above the trend/200MA/.382 fib. Showing to me a nice support zone , i believe we will accumulate here before we get the next push to breakout the zone above. Im still holding my longs. GLIYF

Great time to buy now…
1 Like
Nice, so how is your performance so far? Share with us your trading results.
1 Like
Ok so the second set of waves didnt come to fruition. Weve seen a small sell off in BTC . The big things to note is that we fell through trend and also the 100+200 averages. We have rebounded right off the .382 fib level.
Price is currently trying to break back above the 200 average. We need to see this stick for any chance of a bull to remain for the near future. Its possible it could be a fakeout and collecting liquidity. Not a bad time to load up on longs, will be more confident in the bear when we break that 10K level of resistance.

I just went short - which probably means your right!!!
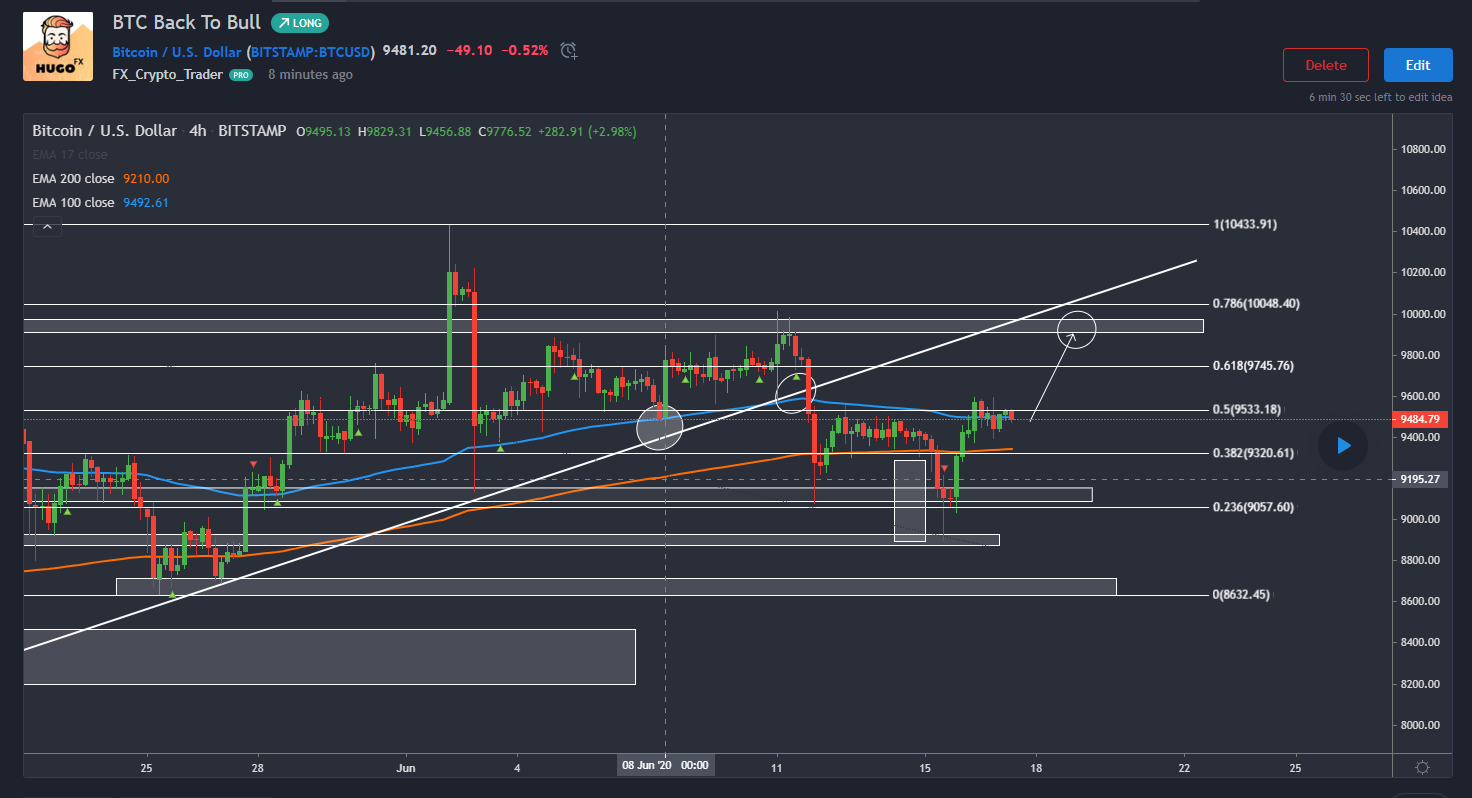
Well to my surprise bitcoin did a little fakeout. Since price broke below the trend and the average i thought it was possible for us to see a drop further down. BUT to my surprise we have seen some bullish price action. A double bottom held on the .382 fib and we now see price back above the avreages, trend and we sit at some resistance. If we can rally above the resistance zone then we might be able to break 9outt o new recent highs. Which would be great for a nice bull run to start again. Im still holding longs. i willre enter if we break above and retest the zone as support. Amazing what a few hours difference can make. GLIYF

Back looking at BTC again today and we have had our new high made, BUT we have seen an instant return in price back below 10K. Was this a liquidity grab for people jumping on longs after the push up? Certainly looks like it to me, we have settled on the 50% fib from previous low swing, rejected and still above 100+200 ema , resting on the trend, the next few days will give us clues to intentions of price movement. But the new high makes room for more push upwards, still holding longs, i TP’d half of my position on the rise.

Well Bitcoin has almost gone exactly to plan so far. i was looking for the push up to the supply zone and then a drop back down to support in my circled area, and we pretty much got what i was looking for. Priced wicked out from the bottom showing good buying pressure, we held on trend and are still bullish in trend, creating higher lows and higher highs. We just need to break above 10.5K and stay there. thats what im looking for
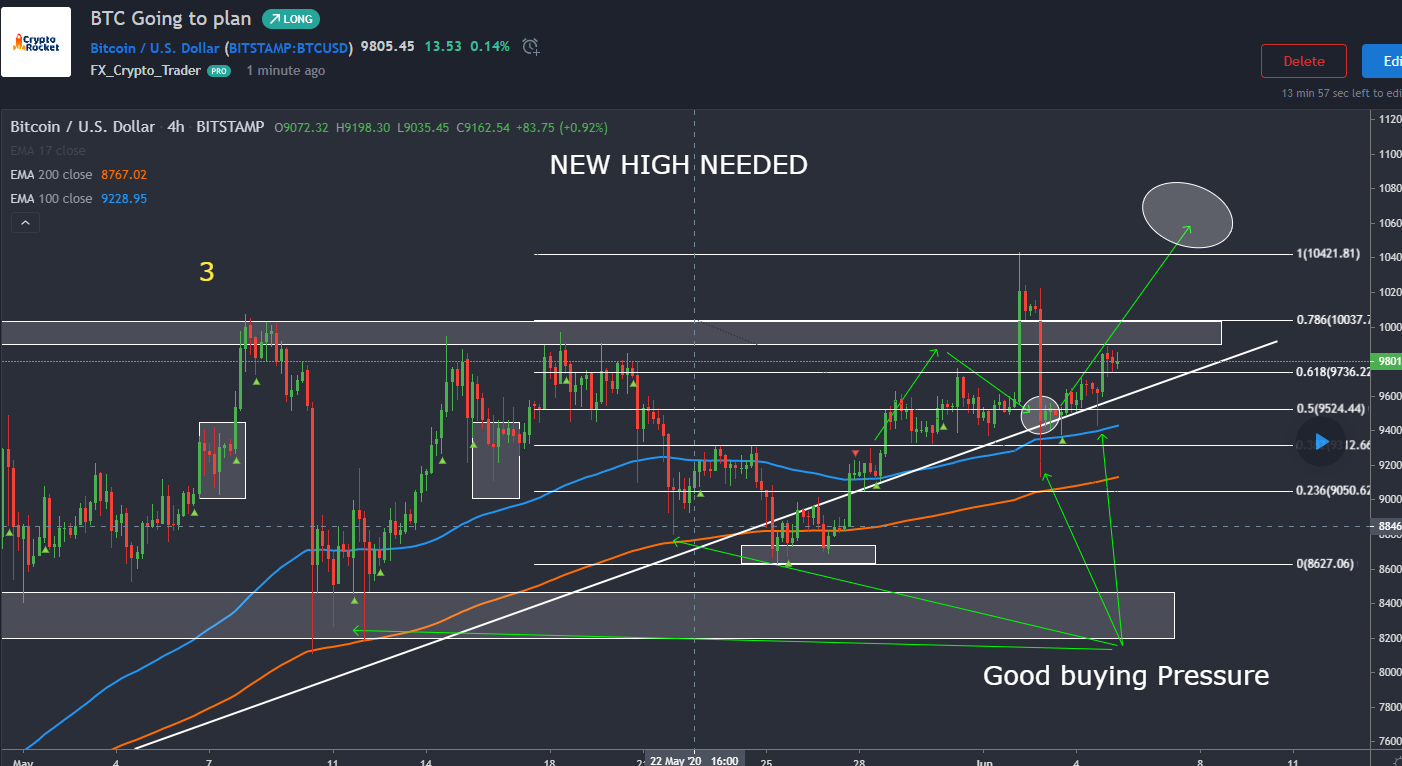
One thing i like about bitcoin is that it respects certain levels and indicators very well. We are still bullish and getting ready for the next pop up in price i believe. you can see when you look close it loves to respect fib levels, EMA’s trends and price patterns. Most recently it rejected right from the trend and .236 fib level for a multiple confluence bullish signal, price held above the 100EMA perfectly then we got a nice bullish engulfing . The pullbacks are small but the bullish gains are quick to strike back. I believe its only a matter of time before were trading above 10.5K

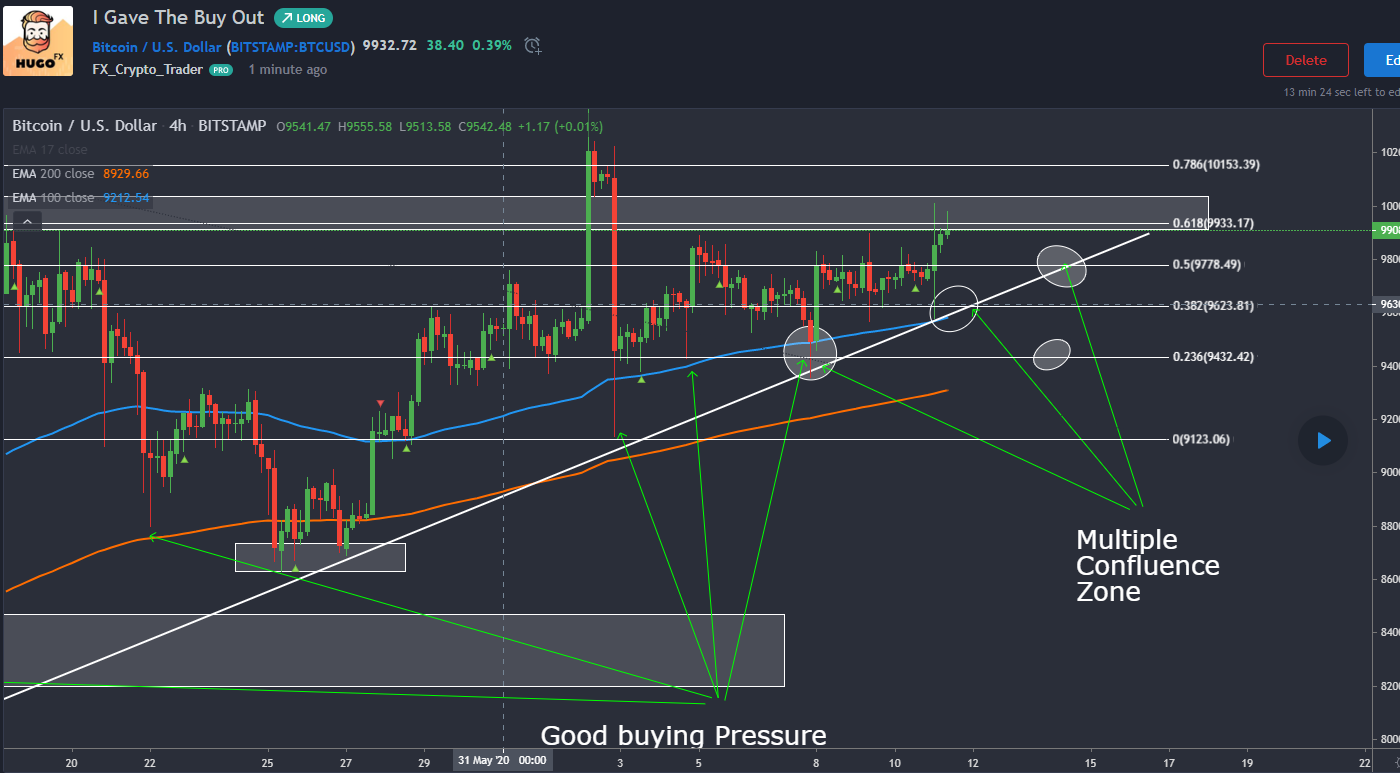
Looks like we’re in a sideways movement with Bitcoin at the moment, small range. i think it could possibly move towards the trend and pick up multiple confluences before we get the next push upwards. Ive marked out a couple of areas that i will be interested in placing longs. GLIYF

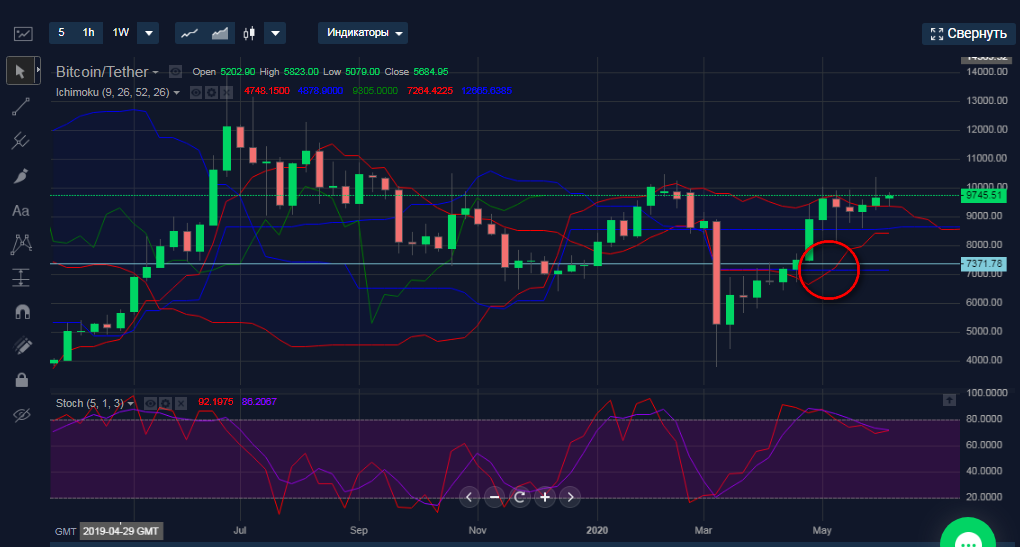
There is an intersection of the Tenkan and Kijun lines. This is a buy signal. Bitcoin is moving above the Ichimoku cloud, but until it goes up, it cannot break the resistance by 10,000. We are waiting for the Tenkan line to rise to the price, and then Bitcoin will move up.
Weekly
1 Like
If you saw my chart yesterday i blatantly pointed out the buy spots. It couldnt of been any easier for you to jump on that buy. price came right down to the trend line and 100EMA. Rejected right off it like expected, 400 pip rise if you was an intra day trainer. Love it when it respects these levels and confluences. Hold if your a HODLER or take the nice profits and but again on the next pullback, or wait for the breakout up top and retest. Plenty of opportunities with bitcoin . GLIYF
Well BTC has shown us its first weakness in recent times. Price has broken down and below the trend. Price currently sits between 100+200 ema , price action is showing us a bearish pennant , so bias would be for a sell for the intra day traders. The question is where will we find support for the next push up? We could reject from the 9100 area like previous and get a big double bottom , or even further below to the support of 8700. One to watch next few days GLIYF

We were looking for the intraday sell last time we looked at BTC . After the initial drop we were looking to sell the bearish pennant . It offered a few hundred pips on the initial drop , but as we can see price rejected right off that little support zone and wicked right out. That was your signal to take profit especially when we got the wicked hammer candle and the doji right after it on the .236 fib level of support. That was your new reversal signal to go long again. We made it back above the EMA’s where price currently sits. Im currently long from 9100 on an intraday position. Already made risk free with SL so will ride this one out. Looking to break to new highs in the coming days as USD seems to be getting weaker overall. GLIYF
Still holding longs on BTC . The chart im seeing is pointing to a move upwards. We’ve got what looks to be an inverted H+S , it might be a messy one but the general shape is there and we have our neckline. We’ve made a higher high and higher low. So now we just wait for the neckline to be broken upwards. the 200 EMA is holding price up well so far so only a matter of time. GLIYF

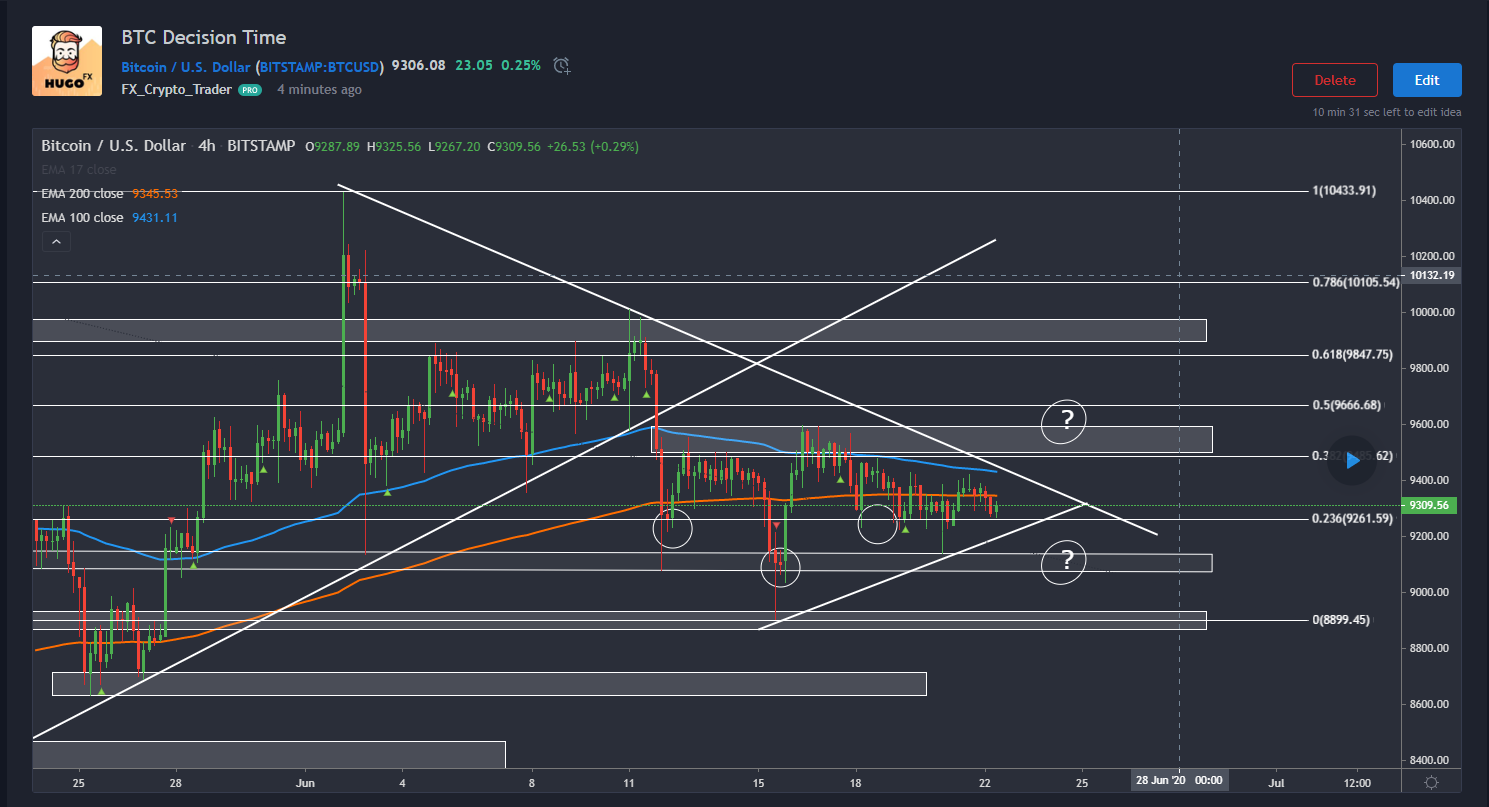
Good morning, new week upon us traders. Bitcoin to me looks like its coming to decision time in technical terms. Price has moved sideways and now were getting squeezed into this wedge . The .236 fib looks like its holding but price is sitting under the EMA’s so it can go either way for me. which direction will win. All i know is i will be trading the winning breaking direction of this wedge . I still hold longs but its set to risk free so i dont lose if it drops. GLIYF
1 Like