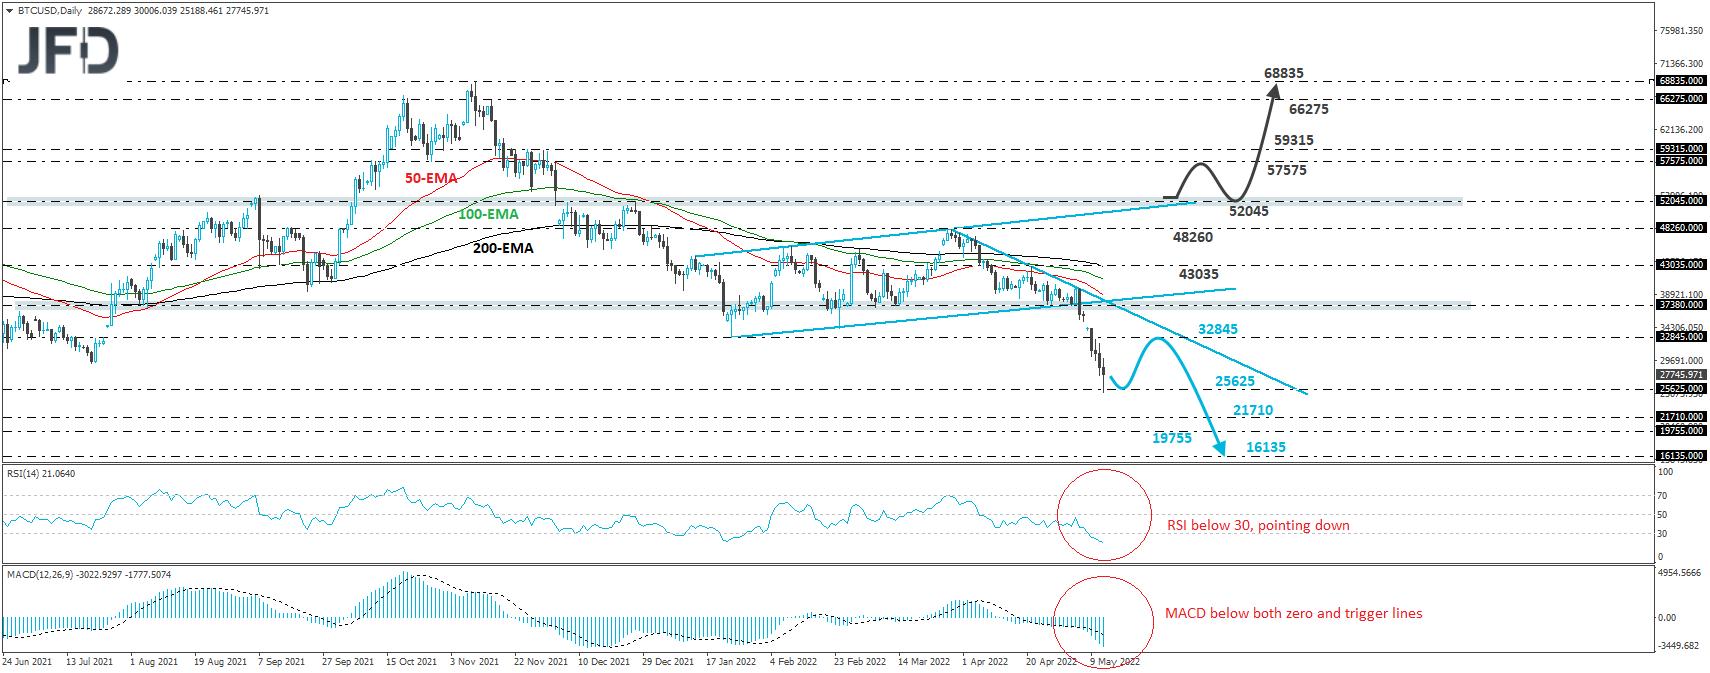
BTC/USD opened with a negative gap this week and every day since then has been a red one. Today, the crypto hit support near the 25625 zone, marked by the low of December 29th, 2020, and then, it rebounded somewhat. Last Thursday, the crypto broke below the upside support line drawn from the low of January 24th, as well as below the key support zone of 373980. In our view, that move was the invitation to the bears.
Now, even if today’s recovery continues for a while more, we believe that the bears could still take charge again from near the 32845 zone, marked by the high of July 21st, and this is because we can mark the latest downtrend with a downside line drawn from the high of March 29th. So, a slide from near 32845 could result in another test near 25625, where a break would confirm a forthcoming lower low and could carry extensions towards the 21710 and 19755 zones, marked by the low of December 21st and the inside swing high of December 1st, 2020, respectively. If neither zone is able to halt the slide, then we may see the bears diving to the low of November 26th, 2020, at around 16135.
Shifting attention to our short-term oscillators, we see that the RSI fell below its 30 zone and still points down, while the MACD remains below both its zero and trigger lines, pointing south as well. Both indicators detect strong downside speed and support the notion for further declines in this crypto.
In order to start examining the bullish case, we would like to see a recovery above the key resistance zone of 52045. The price will also be above the upside resistance line drawn from the high of January 13th, and the bulls may get encouraged to push the battle towards the 57575 barrier, or the 59315 zone, marked by the high of December 3rd and November 30th, 2021. If they are not willing to stop there, then we may see them climbing to the 66275 or 68835 barriers, marked by the highs of November 15th and 10th, respectively.
Disclaimer:
The content we produce does not constitute investment advice or investment recommendation (should not be considered as such) and does not in any way constitute an invitation to acquire any financial instrument or product. The Group of Companies of JFD, its affiliates, agents, directors, officers or employees are not liable for any damages that may be caused by individual comments or statements by JFD analysts and assumes no liability with respect to the completeness and correctness of the content presented. The investor is solely responsible for the risk of his investment decisions. Accordingly, you should seek, if you consider appropriate, relevant independent professional advice on the investment considered. The analyses and comments presented do not include any consideration of your personal investment objectives, financial circumstances or needs. The content has not been prepared in accordance with the legal requirements for financial analyses and must therefore be viewed by the reader as marketing information. JFD prohibits the duplication or publication without explicit approval.
CFDs are complex instruments and come with a high risk of losing money rapidly due to leverage. 72.99% of retail investor accounts lose money when trading CFDs with the Company. You should consider whether you understand how CFDs work and whether you can afford to take the high risk of losing your money. Please read the full Risk Disclosure.
Copyright 2022 JFD Group Ltd.