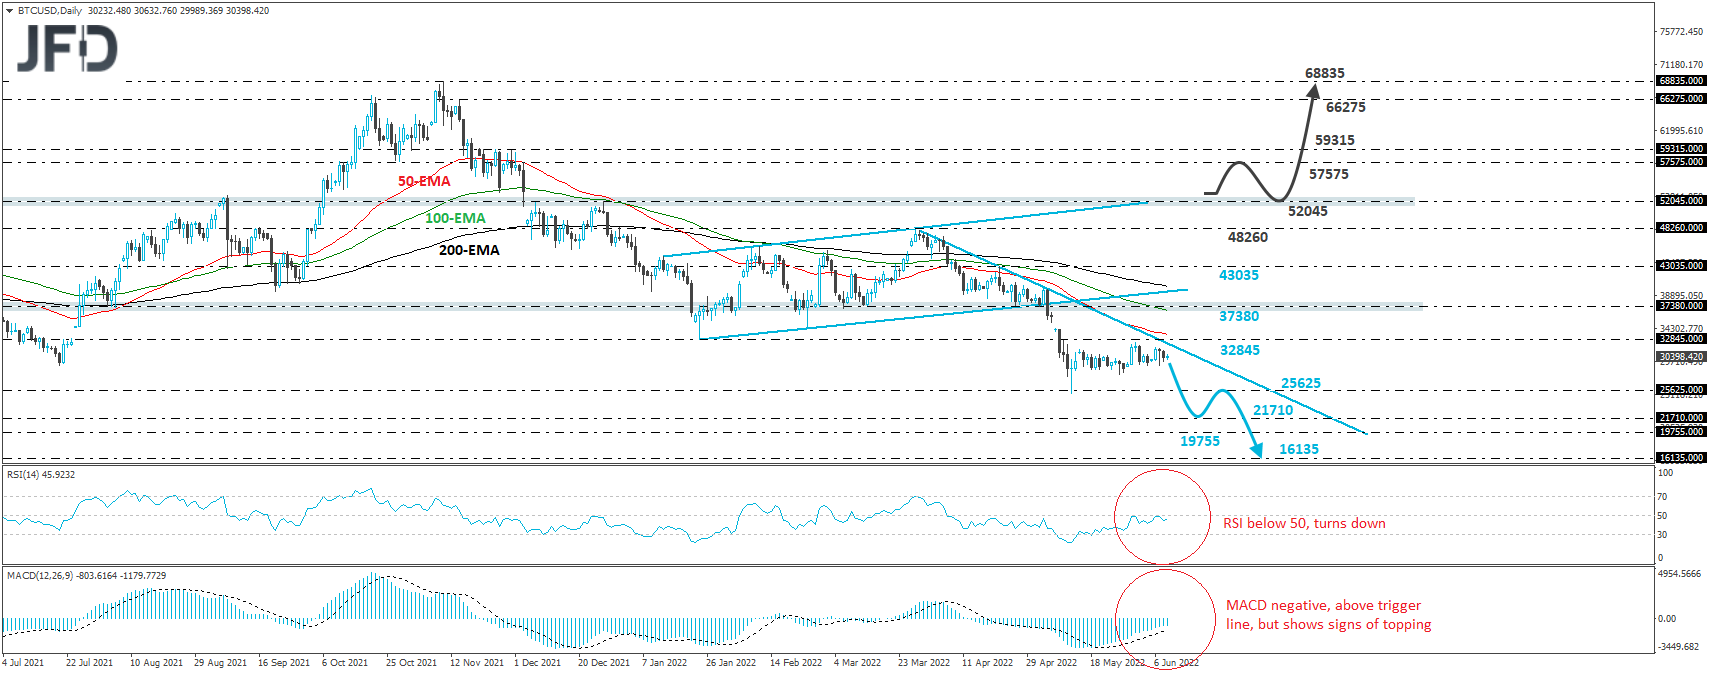
BTC/USD continued to trade in a consolidative manner, staying slightly below the 32845 zone, marked by the low of January 24th, and below the downside resistance line taken from the high of March 28th. On May 5th, the crypto fell below the lower end of an upside channel, and continued to respect the aforementioned downside line, which, in our view, means that the outlook is cautiously negative.
Despite the consolidation, we see decent chances for the bears to take chart again soon and aim for another test at the low of May 12th, near the 25625 zone. A break lower would confirm a forthcoming lower low on the daily and weekly charts and could see scope for extensions towards the low of December 21st, 2020, at around 21710, or the inside swing high of December 1st, 2020, near 19755. If neither barrier is able to halt the slide, then we may see the bears pushing towards the low of November 26th, 2020, at around 16135.
Shifting attention to our short-term oscillators, we see that the RSI turned down after hitting resistance at 50, while the MACD, although above its trigger line, lies within its negative territory, and shows signs of topping as well. Both indicators detect downside speed and support somewhat the notion for the bears to take charge again at some point soon.
In order to start examining whether the bulls have gained back full control, we would like to see a strong advance, and then a break all the way above the 52045 zone, marked by the high of December 27th. This will take the crypto above the upper bound of the pre-mentioned upside channel and could initially see scope for extensions towards the 57575 or 59315 zones, marked by the highs of December 3rd and November 30th, respectively. If neither barrier holds, then the bulls may get encouraged to climb towards the high of November 15th, at 66275, or the high of November 10th, at around 68835.
Disclaimer:
The content we produce does not constitute investment advice or investment recommendation (should not be considered as such) and does not in any way constitute an invitation to acquire any financial instrument or product. The Group of Companies of JFD, its affiliates, agents, directors, officers or employees are not liable for any damages that may be caused by individual comments or statements by JFD analysts and assumes no liability with respect to the completeness and correctness of the content presented. The investor is solely responsible for the risk of his investment decisions. Accordingly, you should seek, if you consider appropriate, relevant independent professional advice on the investment considered. The analyses and comments presented do not include any consideration of your personal investment objectives, financial circumstances or needs. The content has not been prepared in accordance with the legal requirements for financial analyses and must therefore be viewed by the reader as marketing information. JFD prohibits the duplication or publication without explicit approval.
CFDs are complex instruments and come with a high risk of losing money rapidly due to leverage. 72.99% of retail investor accounts lose money when trading CFDs with the Company. You should consider whether you understand how CFDs work and whether you can afford to take the high risk of losing your money. Please read the full Risk Disclosure.
Copyright 2022 JFD Group Ltd.