BNP Paribas is a French international banking group being within 10 largest banks in the world. Headquartered in Paris, it is a merger of Banque Nationale de Paris (BNP) and Paribas. BNP Paribas is a part of Euro Stoxx 50 (SX5E) and CAC40 indices. Investors can trade it under the ticker $BNP at Euronext Paris and under $BNPQY in US in form of ADRs. The group is engaged in retail banking serving more than 30 millions of customers and investment banking operations. BNP Paribas is present on five continents operating in 72 countries.
However, similar to other major European banking stocks like Deutsche Bank and Santander, BNP Paribas stock is showing weakness to sideways price action. Hereby, one can see the stock in a sort of a nesting action. In such kind of development, a broad basis in price can serve as a trampoline leading to an impulsive breakout. The years 2020-2021 should confirm if this expectation is correct.
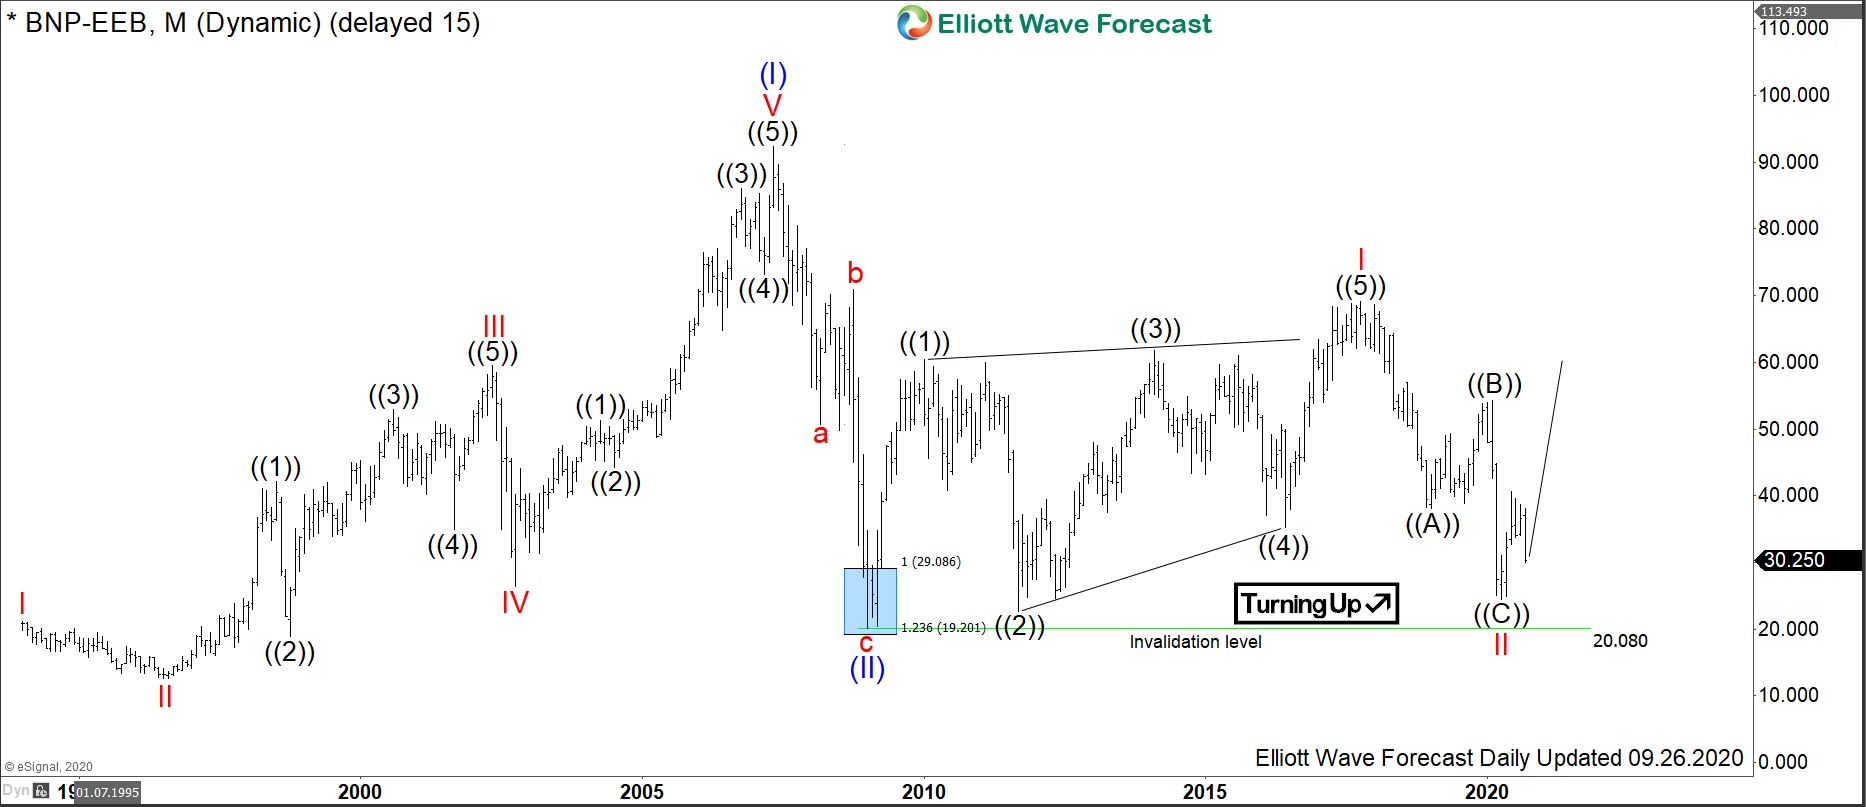
BNP Paribas Monthly Elliott Wave Analysis 09.26.2020
The monthly chart below shows the BNP Paribas stock $BNP traded at Euronext Paris. From the all-time lows, the stock price is showing an Elliott wave motive wave pattern. The cycle up in blue wave (I) of super cycle degree has ended by printing its top on May 2007 at 92.39. After 5 waves higher in (I), the correction in wave (II) has ended on January 2009 at 20.08.
From the 2009 lows at 20.08, $BNP has developed a leading diagonal pattern higher towards 69.21 level in red wave I. Within that cycle, one can see 5 overlapping subwaves of primary degree. After 5 waves, subsequently, a deep correction in wave II has found a bottom in April 2020 at 24.50.
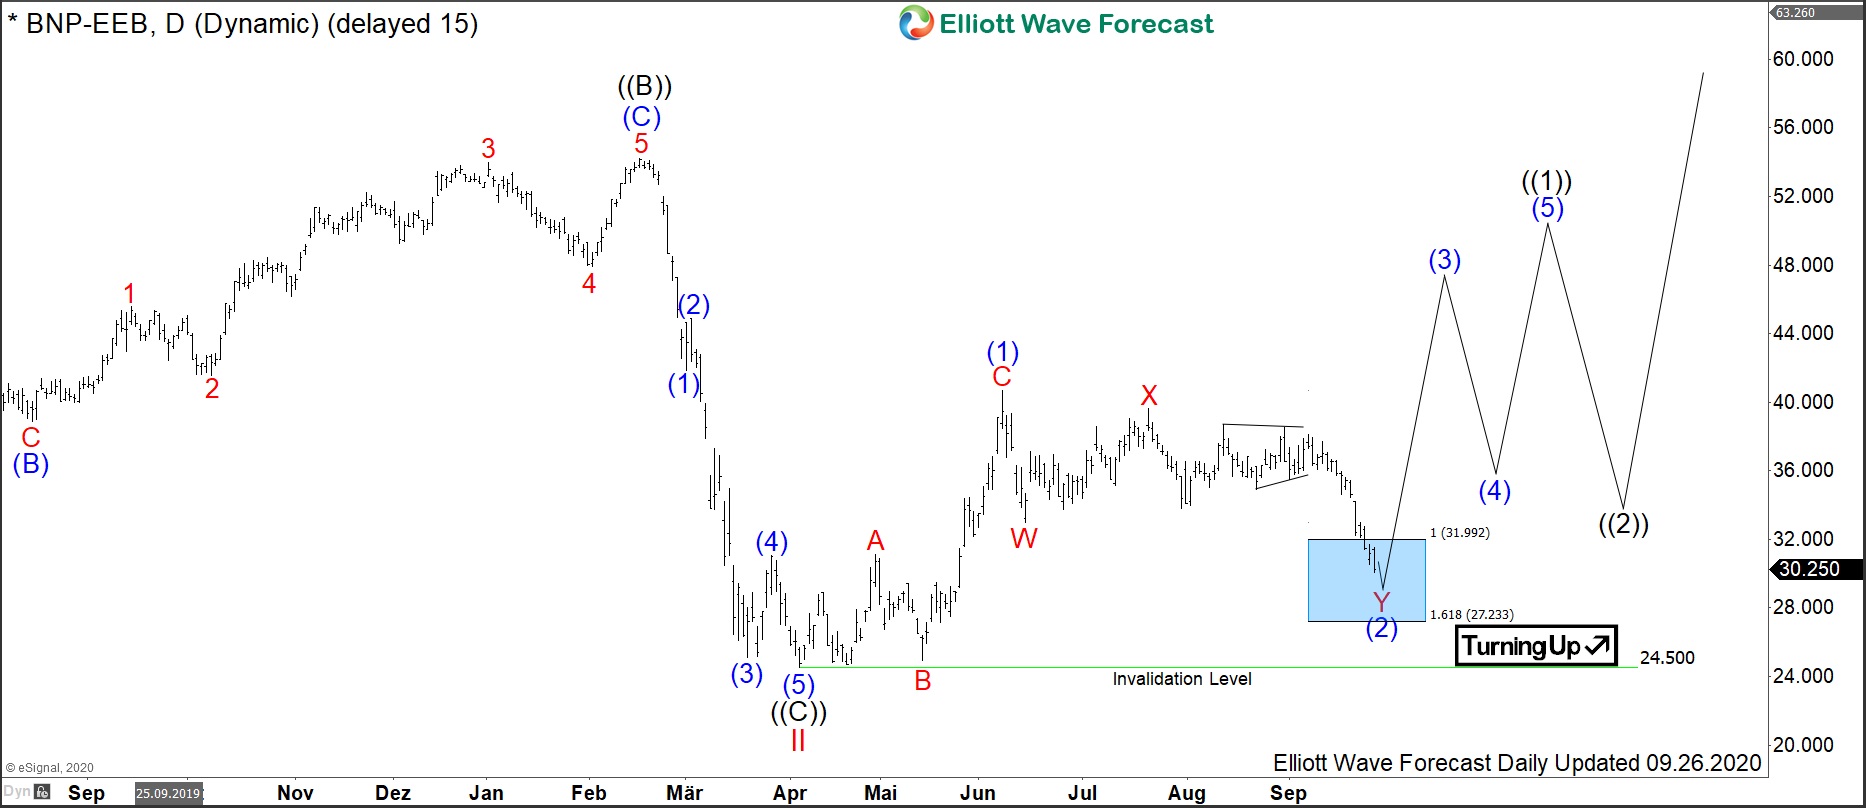
BNP Paribas Daily Elliott Wave Analysis 09.26.2020
The end of the correction in wave II and the turning up action in wave ((1)) of III from the April 2020 lows is shown in more detail in the daily chart below. The rally towards June highs at 40.67 is most likely a 3 waves move. Unless, a larger correction is still in progress, the price development can take the form of a leading diagonal. Within this scenario, the rally from April to June 2020 was the wave (1). The pullback in wave (2) in 3 waves unfolding as an Elliott Wave double three pattern, i.e., a 3-3-3 structure, should find support from 31.99-27.23 area. From there, an advance in wave (3) should break above June highs at 40.67. Ultimatively, expect 5 waves to end the wave ((1)). Then, a pullback in wave ((2)) and an extension higher in wave ((3)) of III should happen.
Therefore, medium-term traders may use 31.99-27.23 area to enter the market for a rally towards 40.67 and higher in wave (3) of ((1)). Long-term traders can do the same, expecting wave III to reach 73.51-103.85 and higher.