All look to be good San but AUD/JPY, NZD/JPY, USD/CAD and AUD/USD are a tad choppy on the weekly re a defind trend? :o
Keep in mind these are MT4 trades so they might no match exactly with RCs.
Long EURUSD
Short USDCHF
Short USDJPY
Long USDCAD
Long EUFCHF
Short AUDJPY
Short CHFJPY
Short NZDJPY
Those were my trades that triggered  Some have closed for profit others are still in play.
Scoob, what are you using to calculate stops? Half the value of the channel?
Using a R:R ratio of 1:2 so TP is full channel stops are initially half of the channel and moved as the trade goes into profit.
I have some concerns about trends changing this week on the Euro and GBP pairs
I see that also.
Its pretty clear which way the trend is or has been on most of those pairs. E/U as an example when would you enter long this week? If I understand the plan it would be around 1.28-1.279. Is that close to what you guys are looking for?
I am not looking to trade this strat as is but its basically the same thing different TF’s as the strat I trade. Recognizing a bias in the market or predicting the next candle with better than 50% odds on any time frame is helpful.
On the weekly, I have the entry at 1.275 at present - doubt it will reach there. Topside resistance for euro is around 1.3130 now.
No trades entered on the weekly timeframe yet - only one that was possible was EURJPY but no clear trend so I didn’t enter short at 113 even though that appears to be a brick wall for the pair.
Haha! My “anti stop hunting strat” has worked :p. Made 1.7% today  I didn’t run the trade as I would have liked, 2 entries one for 1:1 and another for 1:2 but I did use the 1:1 and it worked :p. Today is a good day
I am charting 20 pairs on the Daily and selected price alerts for 13 that looked like the MAs were slanted enough in one direction or another. I set up price alerts in MT4:
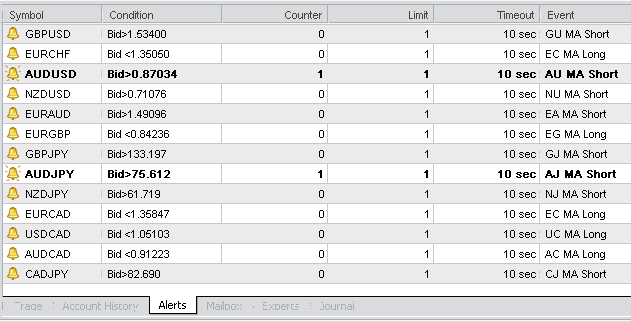
So far I have already gotten two alerts triggered, for Shorts in AUD/USD and AUD/JPY. I didn’t immediately open trades but switched down to the hourly charts with HA candles to look for a color change, as well moves in relation to std Bolls in that TF.
Is anyone else Short in these pairs? Does it look like I’m doing it right? Mother, will they put me in the firing line? Is it just a waste of time? 
I don’t see A/U short according to the strat being discussed? My understanding is it would trigger around .877. Right now price is right in the middle of the channel and heading up on my daily and weekly chart (fxpro mt4).
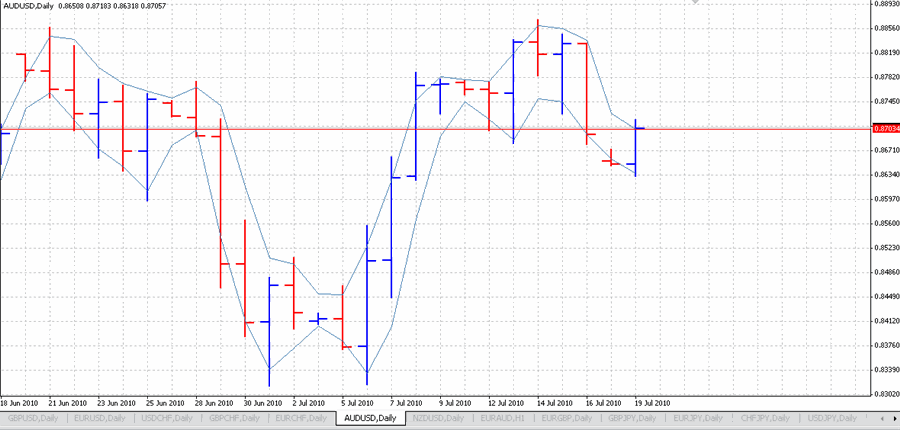
Here’s a screenshot of my MT4 Daily chart for AU, with 2-p H/L LWMAs in place:
This data is off FXCM feed. Although the current candle is bullish, the overall daily trend appears bearish. I have not consulted higher TFs. Does this look different from your chart for AU?
I’m also charting both pairs in my Marketscope platform using the hourly TF and HA candles. Both pairs are in consolidation on that TF and neither has shown an HA color change favoring a downward move, so I haven’t yet opened any positions.
Actually, AU isn’t that bearish really, discounting the large red candle from Friday. That’s another reason why I’m waiting for an additional confirmation of a signal from the lower TF(s).
Also, perhaps the 70-pip difference is from whether your broker feed is including a Sunday candle?
NZDUSD - what do you reckon?
Last week’s candle looking pretty bearish.
Would tie up with an AUDUSD short but that trend hasn’t developed yet.
Wow your A/U daily is not at all the same as mine.
This is what always makes me suspicious of putting to much faith candle patterns alone. If we are watching PA and looking at a few time frames I don’t feel bar or candle differences are that big of a deal. Might sound like a flatliner but price is price all the charts show the same thing.
Edit > the heavy blue lines are 2 period SMA not LWMA
The little up arrow and purple line is a long trade I took today that worked out well for me. The Daily went out of the channel south so I traded north while watching a 15min chart 
I went short today. Looks like the trend has changed, even if it is just a retracement in the long term up trend it looked like enough to take the short today.
Traded lightly Monday as not about but took the bounce on GBP/CHF looking to close out soon’ish. Now looking to AUD/JPY, NZD/USD and AUD/USD all short.
Took four trades my first day using this so far. All losses, of course.
I took my trade signals from price touching whatever MA was opposite to the direction of the sloping LWMAs on the Daily and each time busted out. Still have two more trades active going (UCAD Long and CAD/JPY Short) and in the black, but I have zero confidence so far.
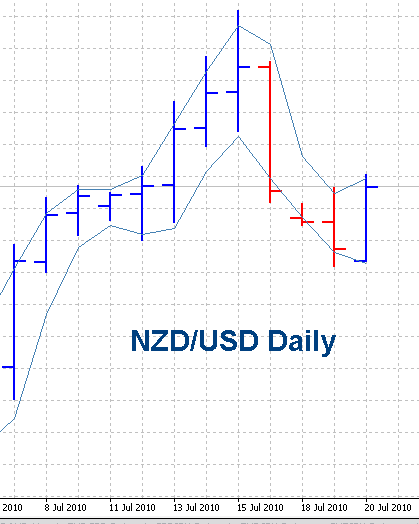
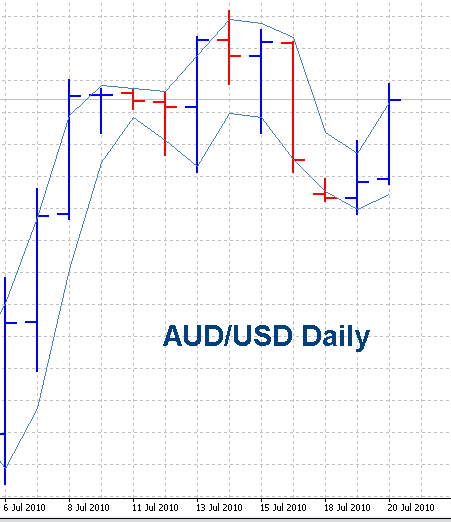
I don’t get two of these. Here are my daily bar charts with 2-p LWMAs:
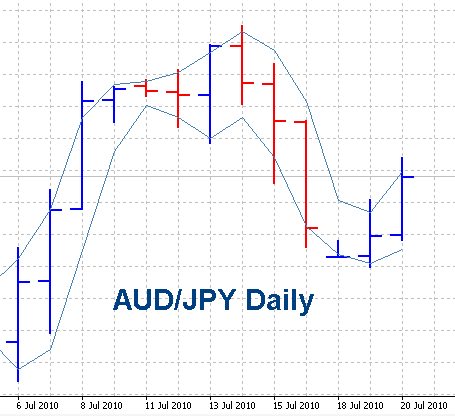
NU seems like it fits your criteria of being in a downward sloping position, supporting a Short when price touches the upper MA. But the other two are clearly sloping upward just looking at the MAs.
What am I missing about your decision to trade these?
What’s this “Marketscope” ?
Best Regards,
Matt Jones 
Am looking for the same directions on those.
My GBPCHF did not trigger as it missed my high LWMA by about 20pips.
EJ triggered though (short) and that is now at break even, has another 75 pips or so to go before hitting target.
Nothing else in action so far this week.
Also, the bank of canada rate decision is this week so I’m not touching any CAD pairs.
i’m still not convinced of bollinger bands.
