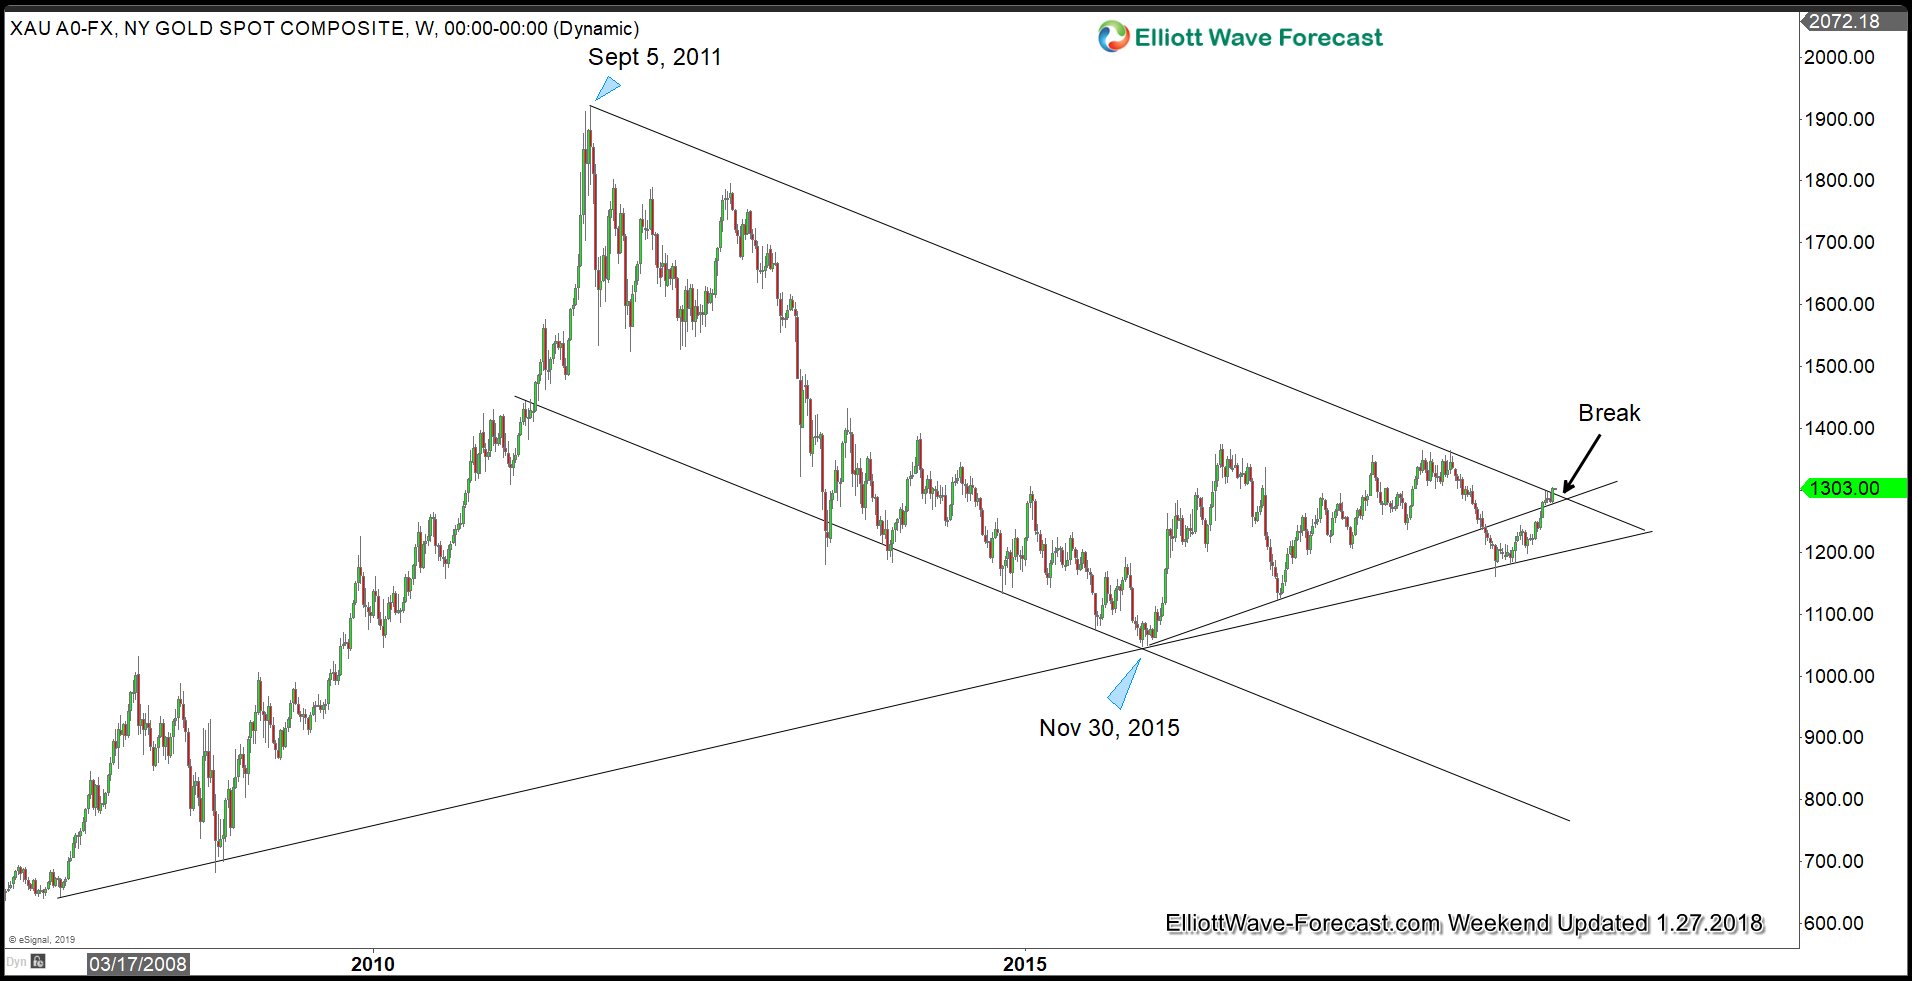
Last Friday Gold managed to break above $1300. The yellow metal has therefore broken above 8 year bearish channel in a weekly closing basis. The break also allows the metal to close back above the ascending trend support from Nov 30, 2015 low as the chart below shows.
GOLD BREAKS ABOVE LONG TERM BEARISH CHANNEL
Earlier this month, we highlighted the possibility that 2019 can be a good year for Gold. We identified several technical as well as fundamental factors which could support the yellow metal. For example, even though Gold has not done much against U.S Dollar, it has broken to all-time high against many emerging market currencies. In addition, it has also made a new all-time high against Australian Dollar earlier this year.
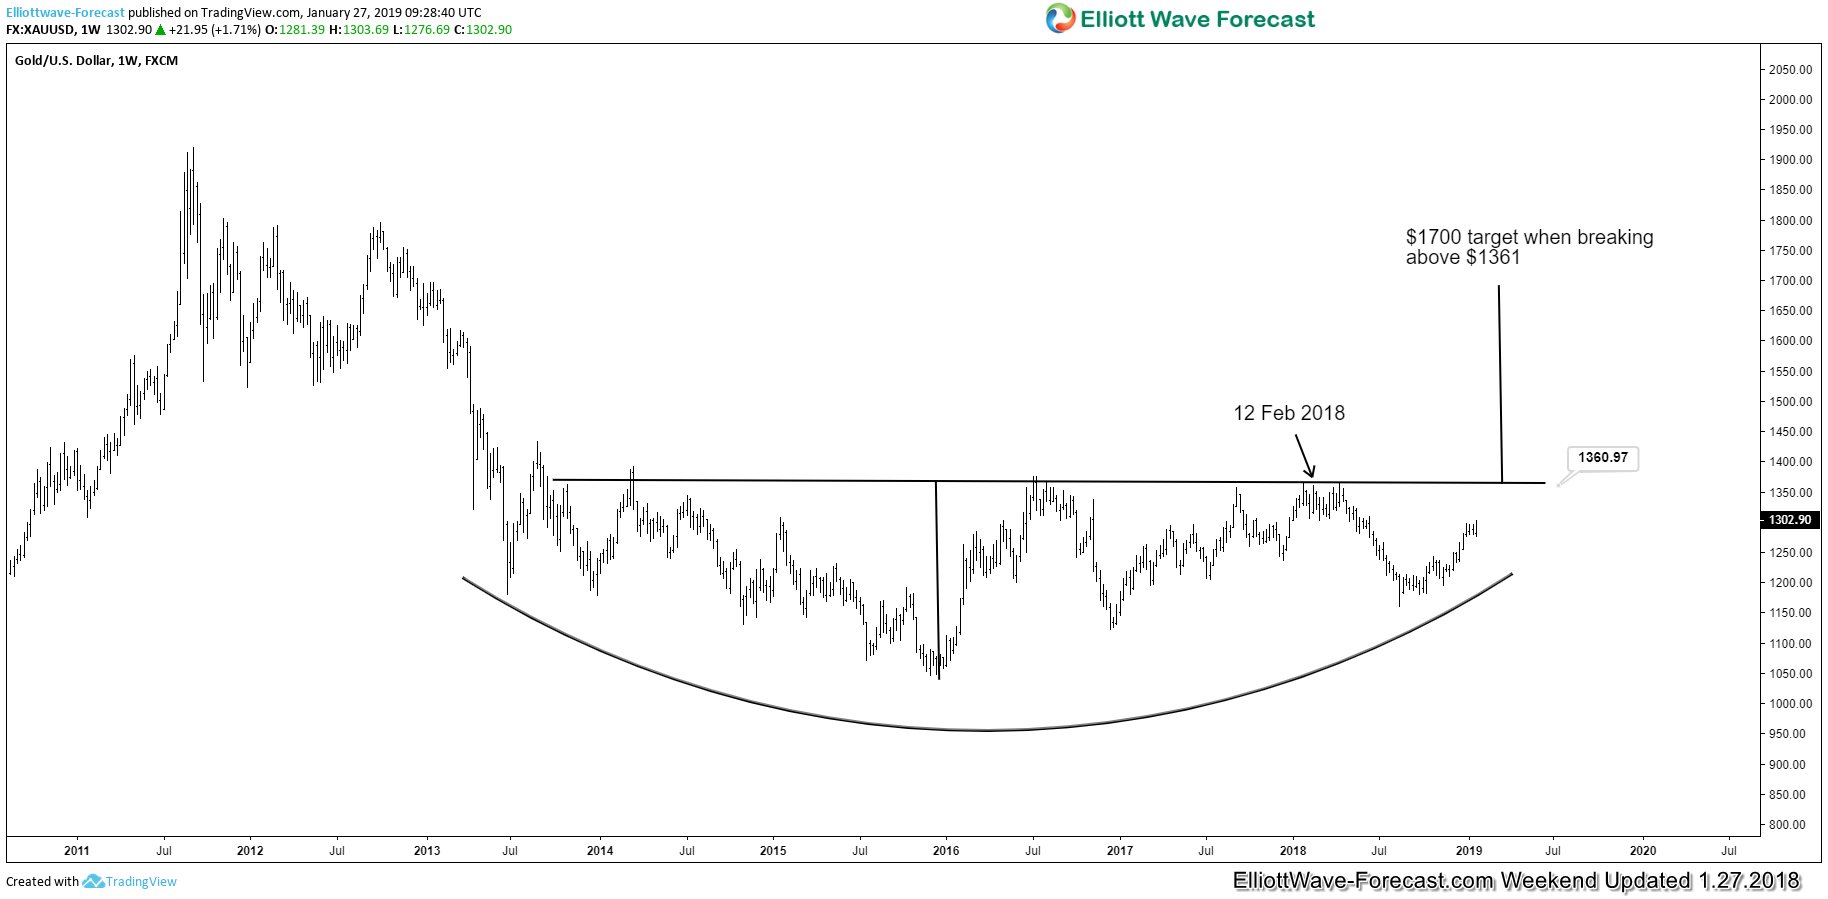
The break above $1300 last Friday likely paves the way for the yellow metal to retest last year’s peak at $1360.
Last week, Gold still had a chance to continue consolidation as far as it stays below $1300. However, we explained in the video that the larger time frame expects a move higher eventually. We also explained the potential that the move from 8/16/2018 low ($1160.37) becomes impulsive if it breaks above $1300. That’s what we had last Friday and thus, we now expect Gold to continue higher as 1 hour weekend chart update below shows.
1 HOUR GOLD WEEKEND ELLIOTT WAVE CHART
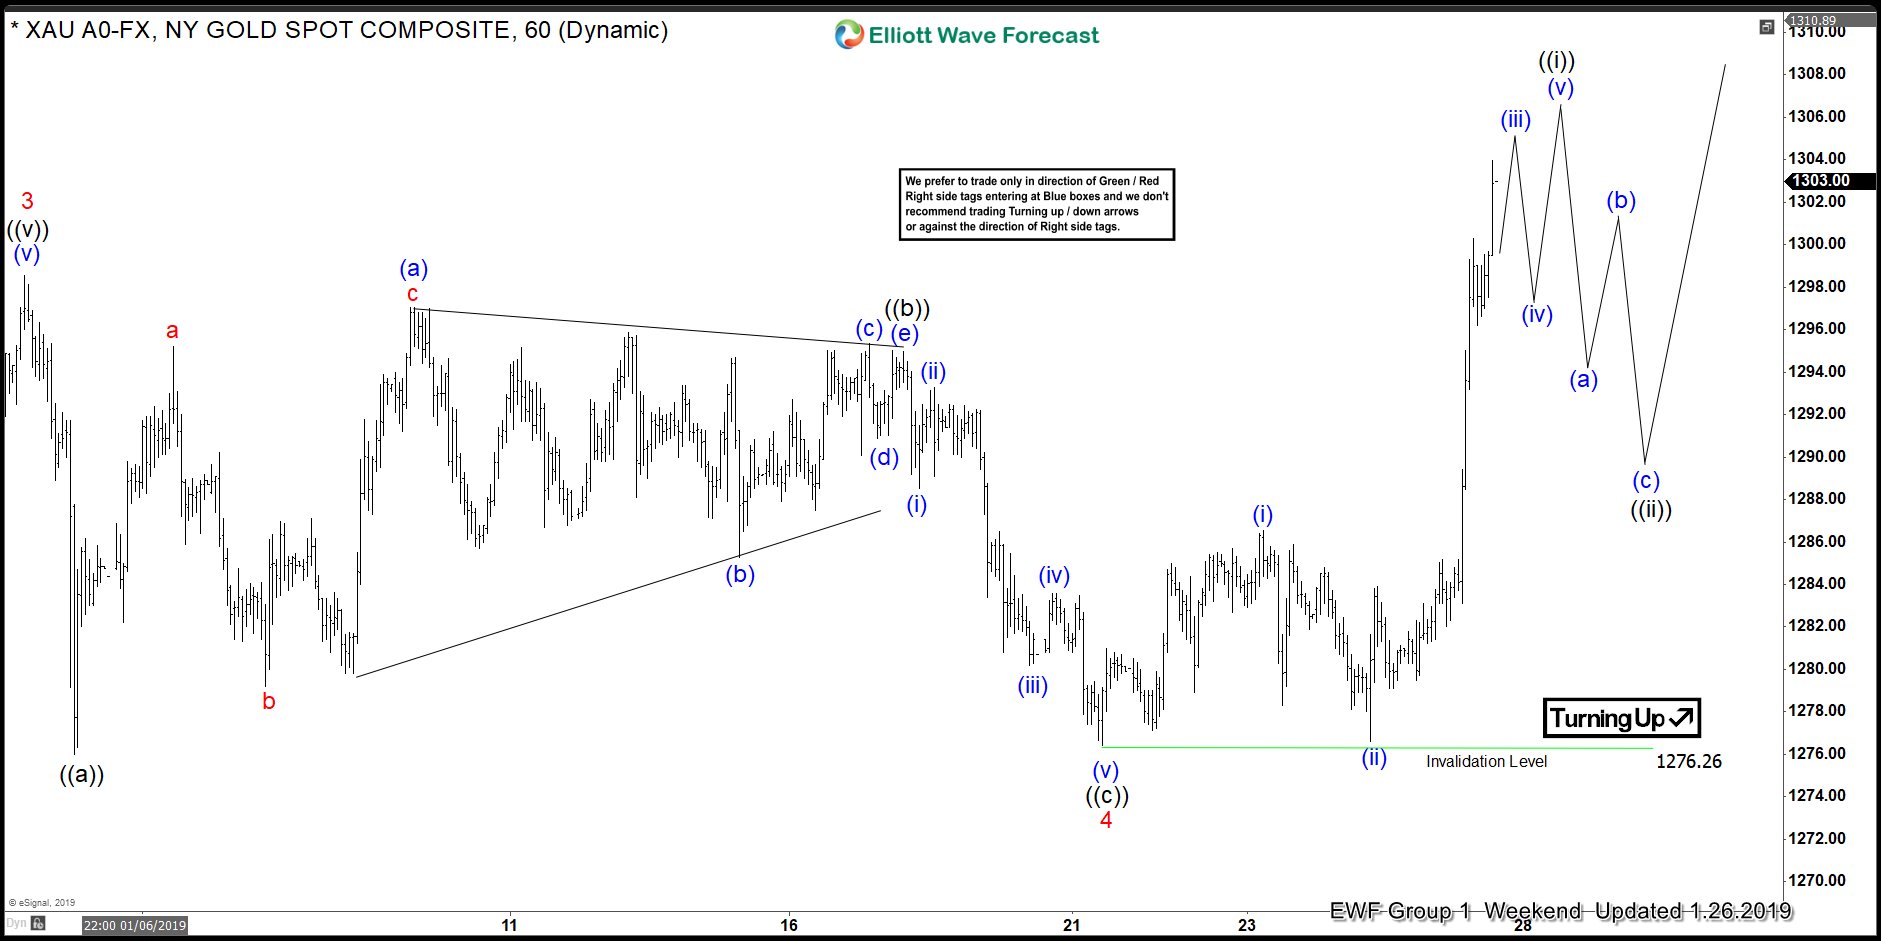
As above chart shows, the short term Elliott Wave structure in Gold now expects the metal to continue higher as far as pullback stays above 1/21/2019 low ($1276.26) in the first degree. The entire rally from 8/16/2018 low ($1160.63) thus becomes impulsive with a nest where the yellow metal now is ending wave 5 of (3).
Gold should now retest $1360 rather quickly, which is a very significant level that has been tested multiple times. A decisive break and close above the level suggests a potential move to $1700 as the next swing target.
Keep in mind that market is dynamic and the outlook may have changed since the writing time of the article.
