Brent Crude (BZ) is the leading global price benchmark for Atlantic basin crude oils. It is used to set the price of two-thirds of the world’s internationally traded crude oil supplies. It is one of the two main benchmark prices for purchases of oil worldwide, the other being West Texas Intermediate (WTI). Brent Crude formed significant low on 4.20.2020 low at $15.74 and rally almost 10x to $137 in 2022 before pulling back. In this article, we will look at the Elliott Wave outlook for Brent Crude and when to anticipate the pullback is complete.
Brent Crude Weekly Elliott Wave Chart
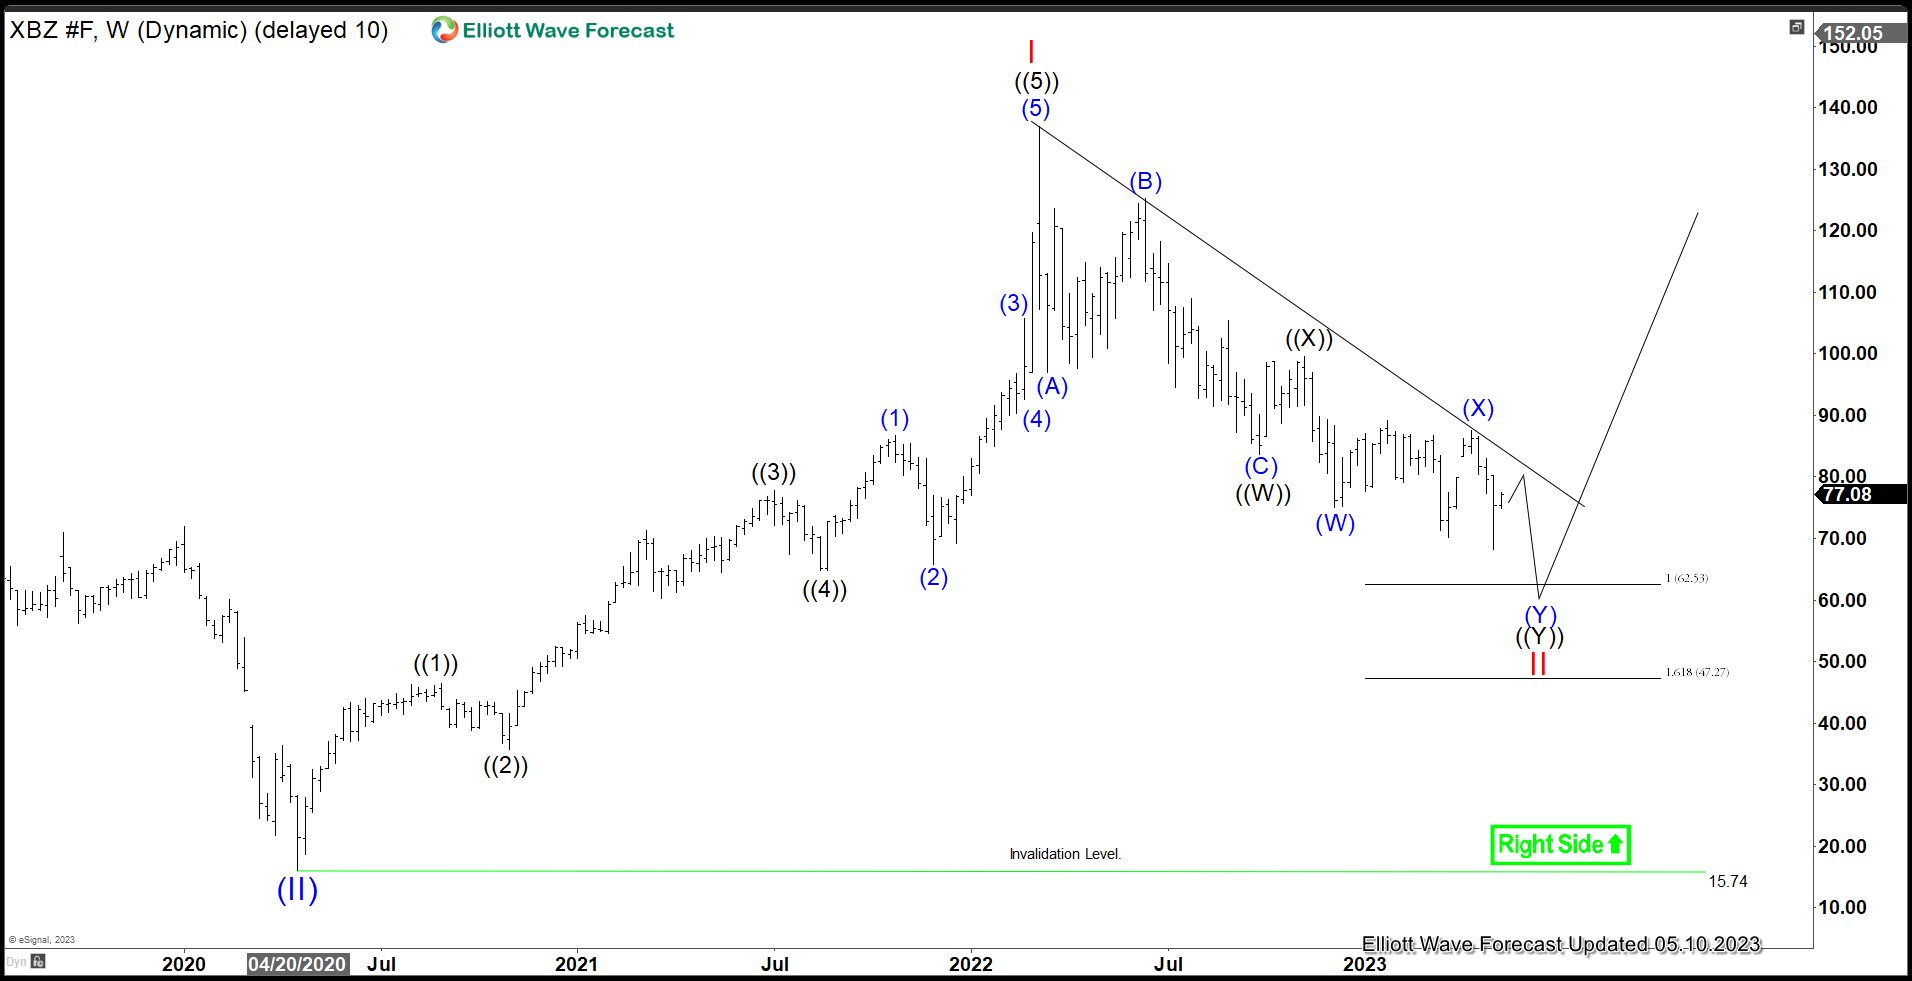
The weekly Elliott Wave Chart of Brent Crude above shows it formed Super Cycle wave (II) low at 15.74 in April 2020 during the Covid-19 selloff. Since then it has rallied significantly and ended wave I at 137 in March 2022. It’s now doing a pullback in wave II to correct the rally from April 2020 low. We are still waiting for a sign of bottoming. At this stage, not enough separation is seen yet, thus there’s still a possibility of extension lower. We will use the descending trend line from March 2022 high to guide and warn us that the correction is already complete. In the meantime, as far as the trend line has not been broken, another leg lower still can’t be ruled out to 47.2 - 62.5 where wave (Y) will be equal to wave (W).
Brent Crude Daily Elliott Wave Chart
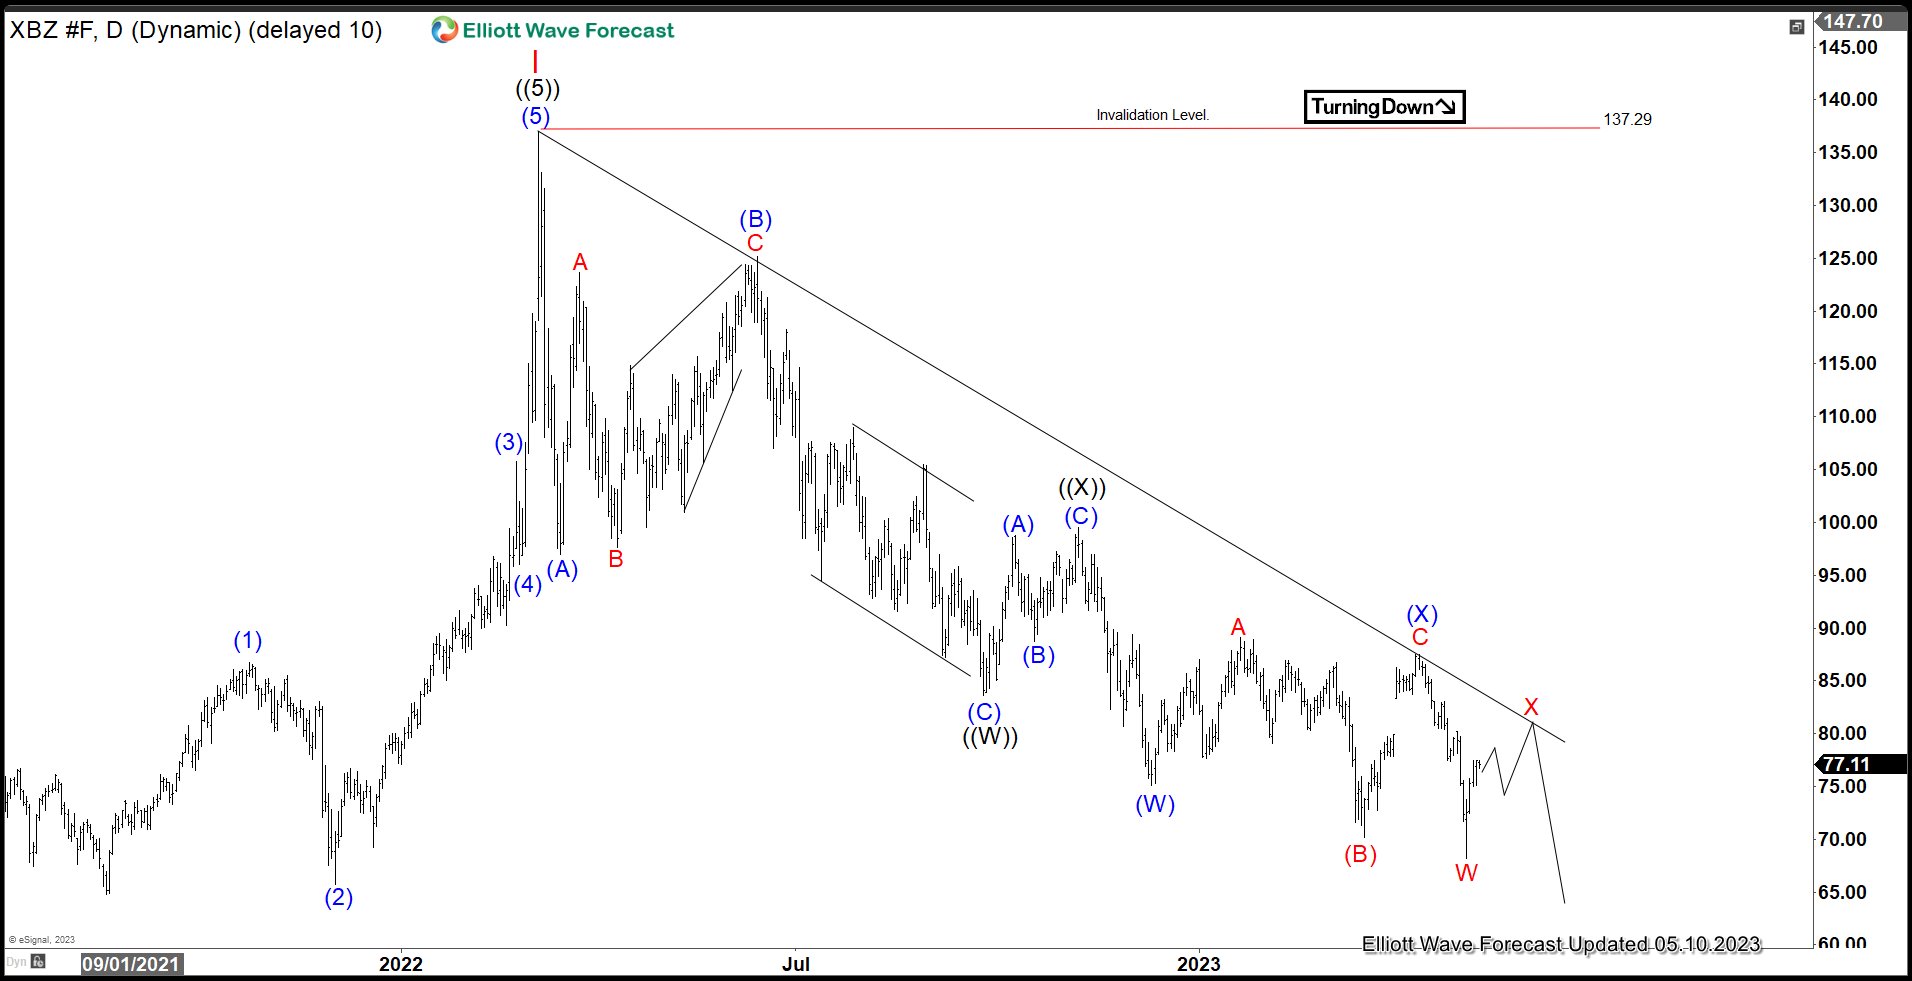
The Daily Chart of Brent Crude oil above shows the decline from wave I peak is unfolding as a double three Elliott Wave structure. Down from wave I, wave ((W)) ended at 83.62 and rally in wave ((X)) ended at 99.56. The instrument has resumed lower in wave ((Y)) with internal subdivision as another double three. Down from wave ((X)), wave (W) ended at 75.11 and wave (X) ended at 87.49. As long as it stays below the bearish channel, we can’t rule out further downside in Brent Crude.