Since the crash of March 2020, all stocks have tried to recover what they lost and P&G was no exception. P&G did not only recover the lost, but It also reached historic highs Now, we are going to try to build an impulse from wave II when it is completed with a target around to $167.14 – $173.32.
P&G Daily Chart
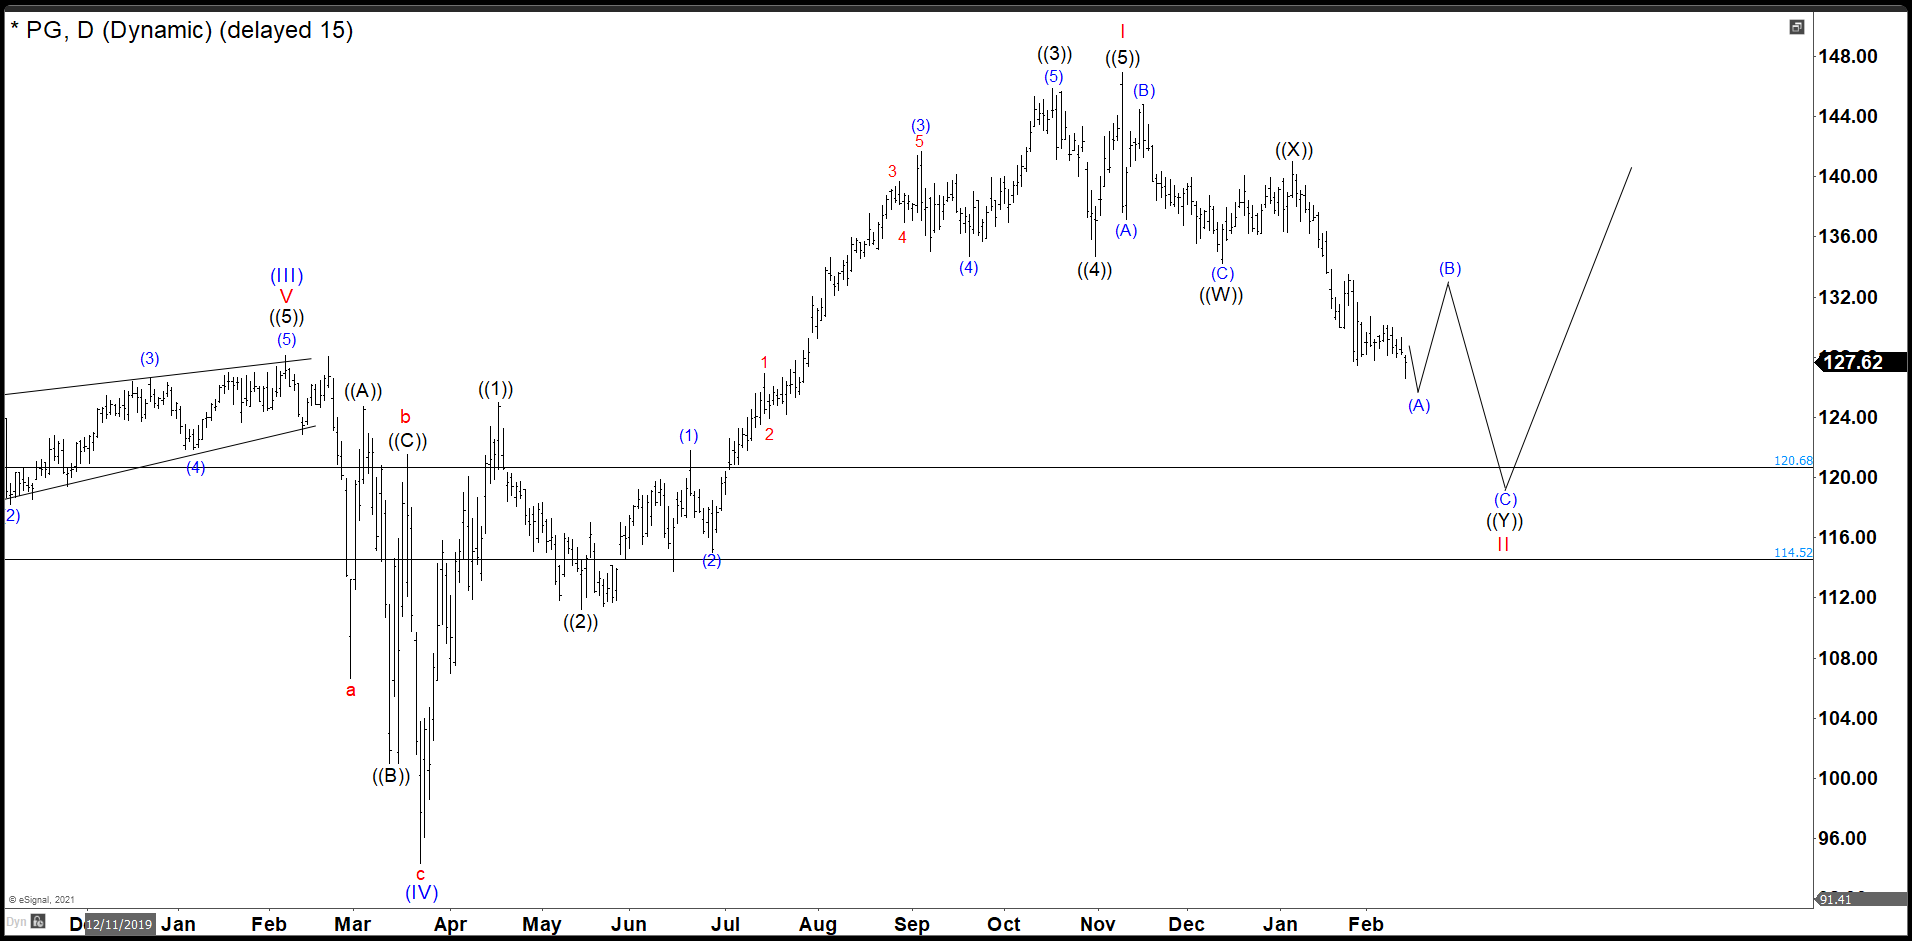
As we see in the daily chart, P&G built an impulse ((1)), ((2)), ((3)), ((4)), and ((5)) that we call I in red and it ended at 146.92. Since November, the stock has dropped only. We see 3 swings down (A), (B), and © as wave ((W)) and then a wave ((X)) as a corrective structure. We are looking for 3 more swings down to complete wave ((Y)) and II as a double correction in $114.52 – $128.68 area, it could be lower, but for now is the ideal one. From here, we expect to continue the rally to a new high in an impulse structure. (If you want to learn more about Elliott Wave Theory, please follow this link: Elliott Wave Theory).
P&G 30 Minutes Chart
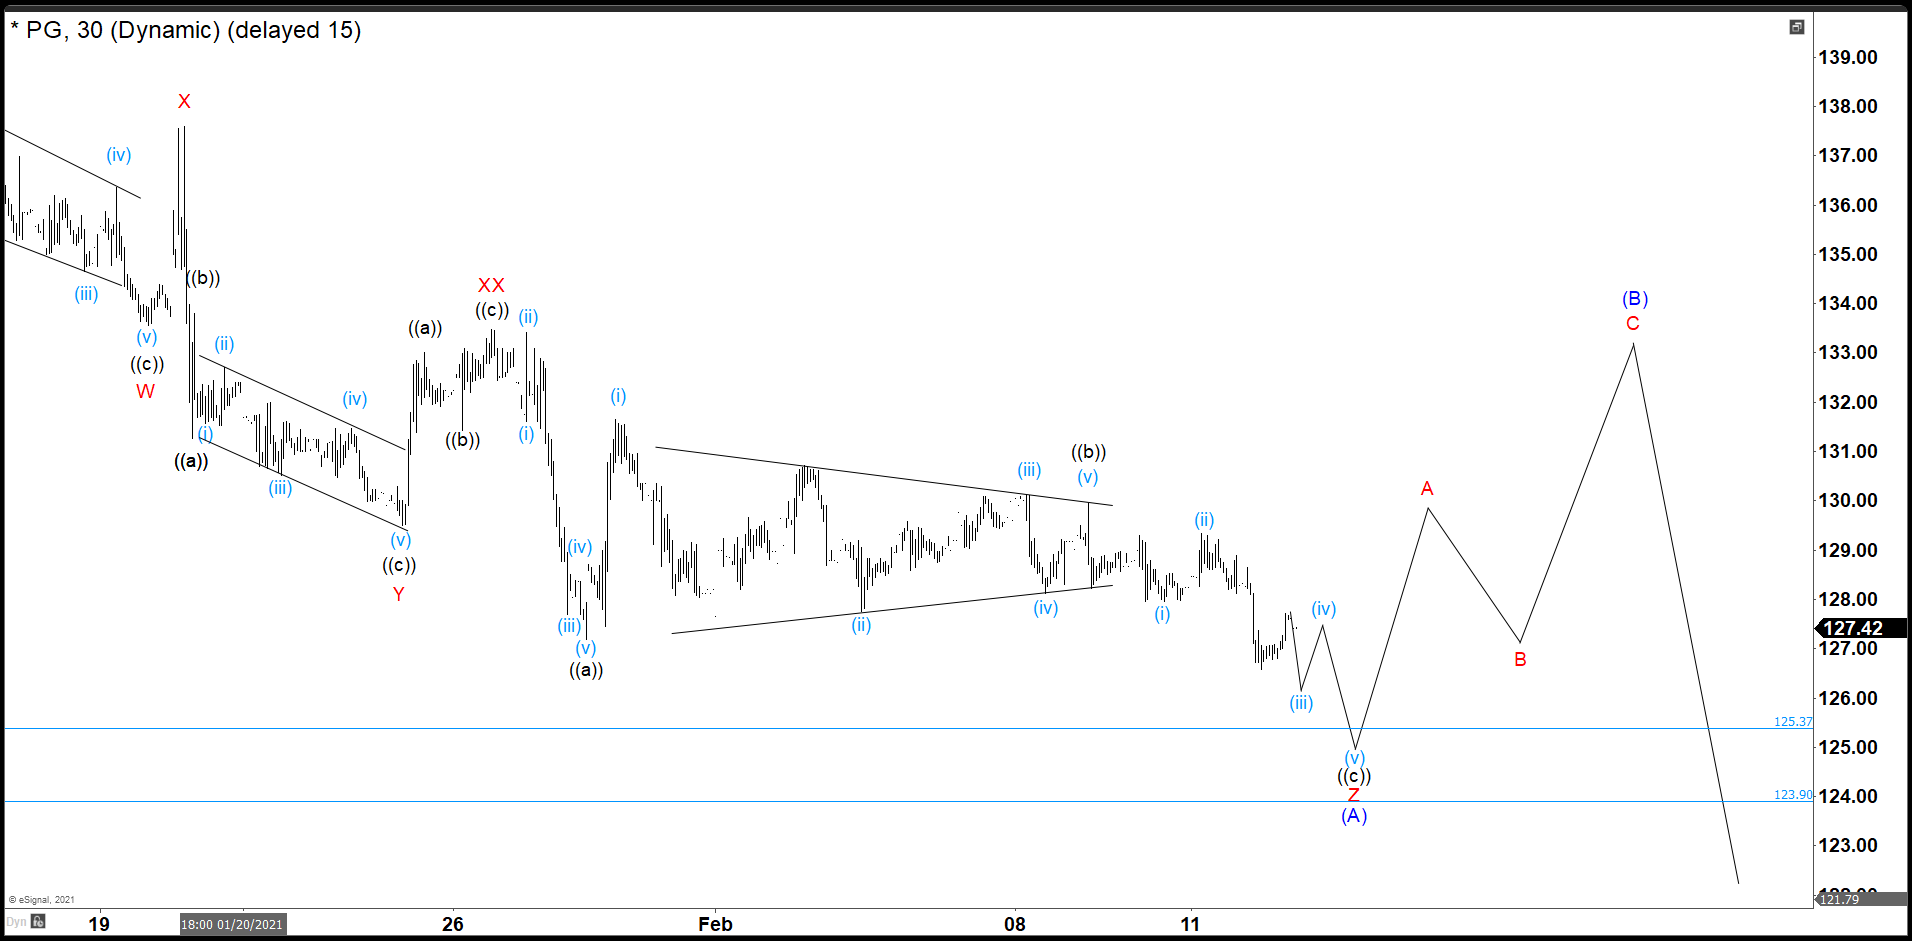
In the 30 minutes chart, we are ending a triple correction as wave (A). We are in the last 3 waves of Z where wave ((a)) finished at 127.42 and we did a triangle as wave ((b)) at 129.96. Now, we are looking a little lower to complete the cycle in 123.90 – 125.37 area. After that we should rally at least to 133.50 dollars as wave (B).